QUESTION IMAGE
Question
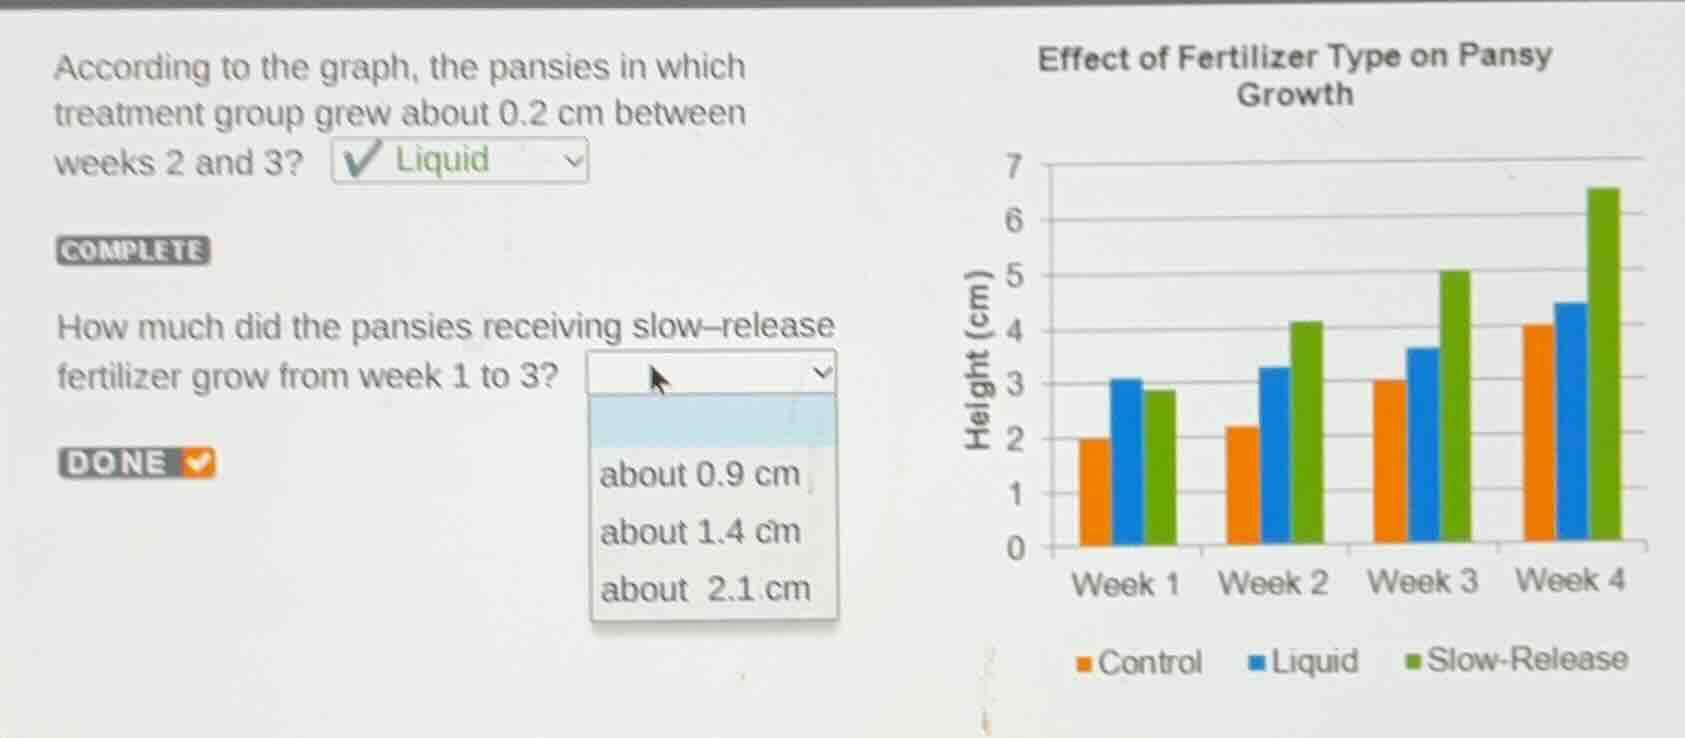
according to the graph, the pansies in which treatment group grew about 0.2 cm between weeks 2 and 3? liquid
how much did the pansies receiving slow-release fertilizer grow from week 1 to 3?
about 0.9 cm
about 1.4 cm
about 2.1 cm
Identify the target group and weeks
We need to find the growth of pansies receiving Slow-Release fertilizer (green bars) from Week 1 to Week 3.
Read the height at Week 1
Using Scientific Measurement principles to read the bar graph:
- At Week 1, the green bar representing "Slow-Release" fertilizer is slightly below the \(3\text{ cm}\) line.
- It is approximately \(2.9\text{ cm}\).
Read the height at Week 3
- At Week 3, the green bar representing "Slow-Release" fertilizer is slightly above the \(5\text{ cm}\) line.
- It is approximately \(5.0\text{ cm}\) to \(5.1\text{ cm}\) (specifically, it aligns very closely with \(5.0\text{ cm}\)).
Calculate the growth
Subtract the Week 1 height from the Week 3 height:
$$
\text{Growth} = 5.0\text{ cm} - 2.9\text{ cm} = 2.1\text{ cm}
$$
This matches the option "about 2.1 cm".

Snap & solve any problem in the app
Get step-by-step solutions on Sovi AI
Photo-based solutions with guided steps
Explore more problems and detailed explanations
- about 0.9 cm
- about 1.4 cm
- about 2.1 cm (Correct answer)