QUESTION IMAGE
Question
20 multiple choice 1 point
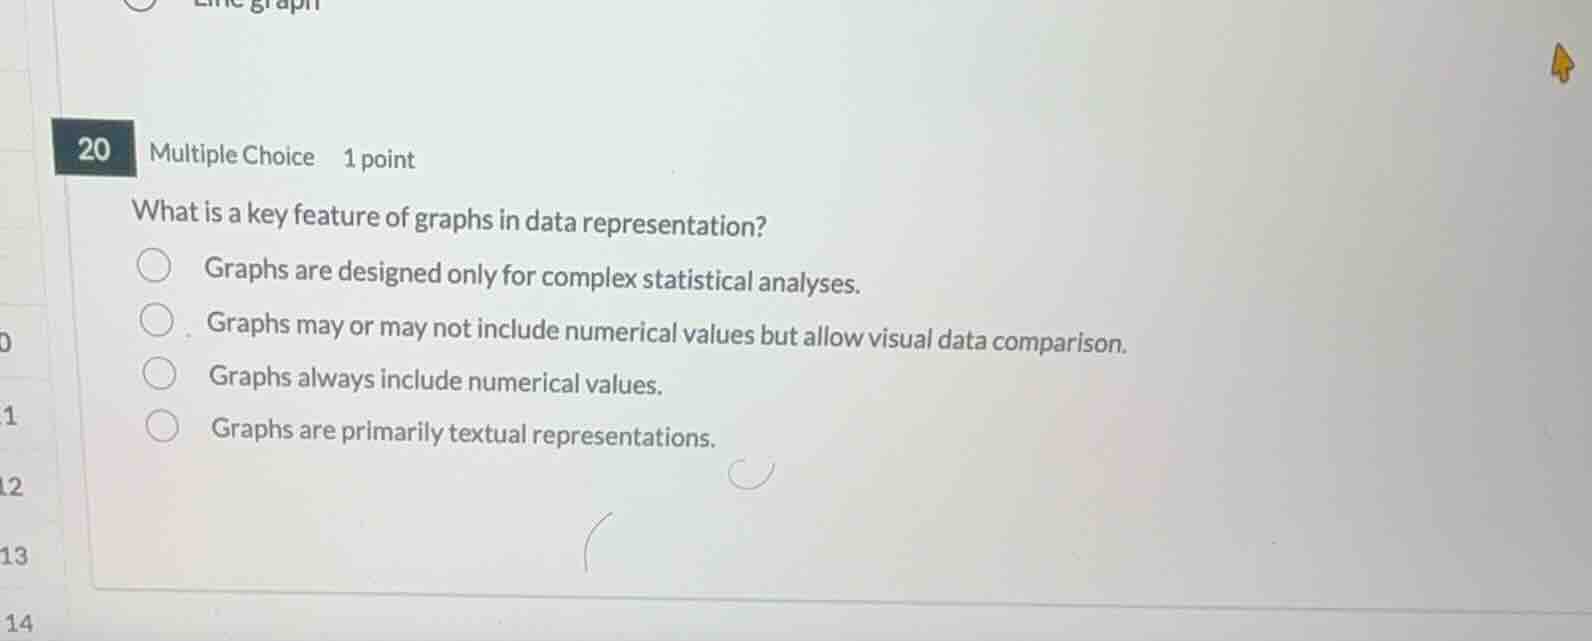
what is a key feature of graphs in data representation?
graphs are designed only for complex statistical analyses.
graphs may or may not include numerical values but allow visual data comparison.
graphs always include numerical values.
graphs are primarily textual representations.
Analyze the purpose of graphs in data representation
Graphs are visual tools used to represent data, making relationships and comparisons easier to understand. They do not always require numerical values (e.g., conceptual diagrams, flowcharts, or qualitative comparison charts) and are certainly not purely textual.
Evaluate the given options
- Option 1: Incorrect. Graphs are used for simple as well as complex data representation.
- Option 2: Correct. Graphs allow visual comparison of data, and while many have numerical values, some represent qualitative relationships or categories without explicit numbers.
- Option 3: Incorrect. Not all graphs require numerical values (e.g., Venn diagrams, mind maps, or qualitative bar charts).
- Option 4: Incorrect. Graphs are visual, not primarily textual.

Snap & solve any problem in the app
Get step-by-step solutions on Sovi AI
Photo-based solutions with guided steps
Explore more problems and detailed explanations
- (A) Graphs are designed only for complex statistical analyses.
- (B) Graphs may or may not include numerical values but allow visual data comparison. (Correct answer)
- (C) Graphs always include numerical values.
- (D) Graphs are primarily textual representations.