QUESTION IMAGE
Question
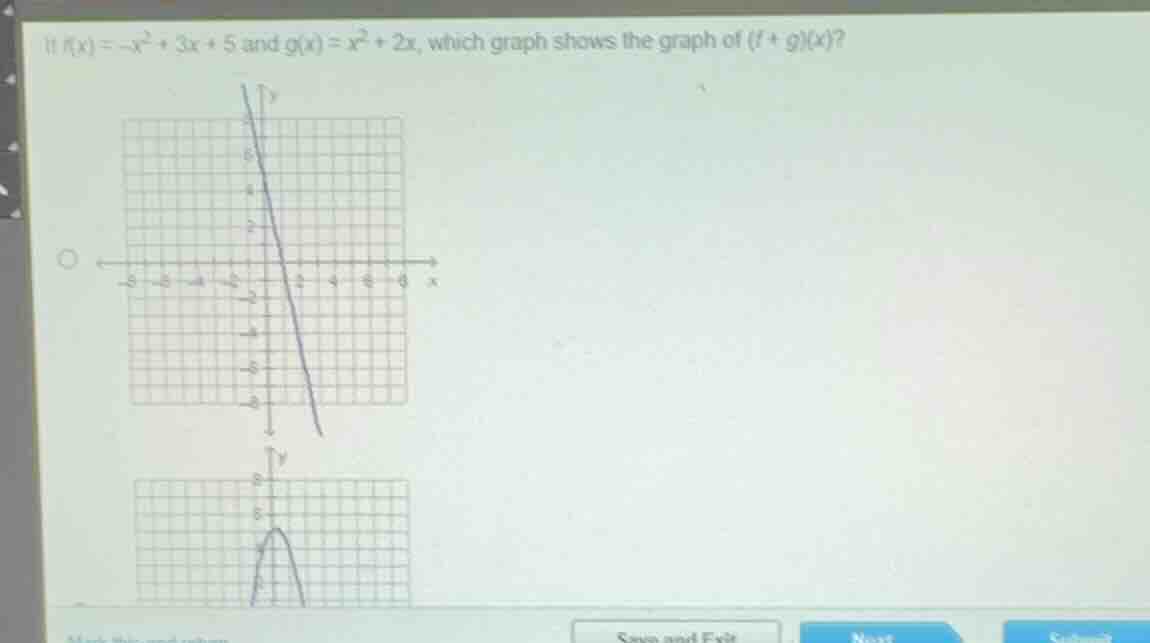
if \\(f(x) = -x^2 + 3x + 5\\) and \\(g(x) = x^2 + 2x\\), which graph shows the graph of \\((f+g)(x)\\)?
Find the sum function
Using the Linear Modeling knowledge point
$$
LATEXBLOCK0
$$
Analyze the resulting graph
Using the Slope-Intercept Form knowledge point
$$
LATEXBLOCK1
$$
Identify the correct graph
The first graph shown in the image is a straight line passing through the y-intercept \((0, 5)\) and the x-intercept \((-1, 0)\). The second graph is a parabola opening downwards. Therefore, the first graph represents the function \((f+g)(x) = 5x + 5\).

Snap & solve any problem in the app
Get step-by-step solutions on Sovi AI
Photo-based solutions with guided steps
Explore more problems and detailed explanations
- (A) The first graph (a straight line with a y-intercept of 5 and an x-intercept of -1) (Correct answer)
- (B) The second graph (a downward-opening parabola)