QUESTION IMAGE
Question
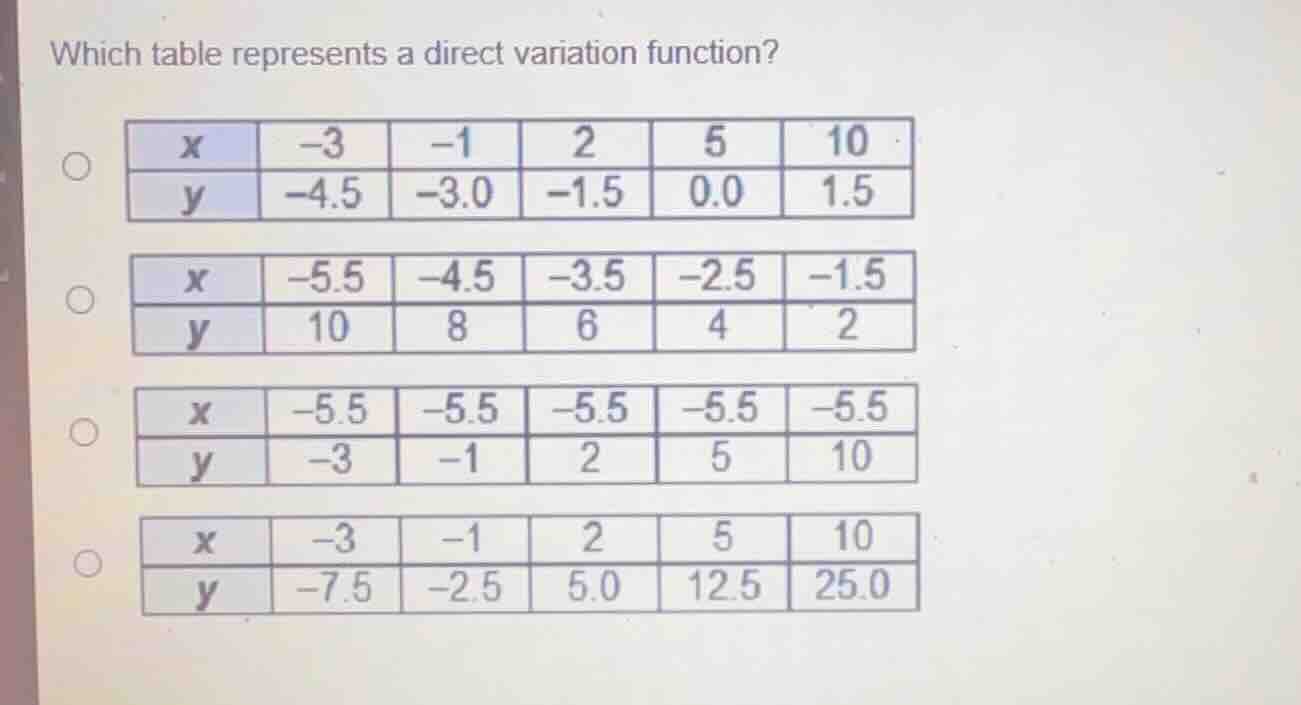
which table represents a direct variation function?
Define direct variation
A direct variation function is a relationship between two variables, \(x\) and \(y\), that can be written in the form:
where \(k\) is a non-zero constant called the constant of variation. This means that for every data point \((x, y)\) in the table, the ratio of \(y\) to \(x\) must be constant:
Analyze the first table
Let's test the ratio \(\frac{y}{x}\) for the data points in the first table:
- For \(x = -3\), \(y = -4.5\): \(\frac{-4.5}{-3} = 1.5\)
- For \(x = -1\), \(y = -3.0\): \(\frac{-3.0}{-1} = 3.0\)
Since the ratios are not equal (\(1.5
eq 3.0\)), this table does not represent a direct variation.
Analyze the second table
Let's test the ratio \(\frac{y}{x}\) for the data points in the second table:
- For \(x = -5.5\), \(y = 10\): \(\frac{10}{-5.5} \approx -1.82\)
- For \(x = -4.5\), \(y = 8\): \(\frac{8}{-4.5} \approx -1.78\)
Since the ratios are not equal, this table does not represent a direct variation.
Analyze the third table
In the third table, the value of \(x\) is constant at \(-5.5\) while \(y\) changes. This represents a vertical line \(x = -5.5\), which is not a function and does not represent a direct variation.
Analyze the fourth table
Let's test the ratio \(\frac{y}{x}\) for all data points in the fourth table:
- For \(x = -3\), \(y = -7.5\): \(\frac{-7.5}{-3} = 2.5\)
- For \(x = -1\), \(y = -2.5\): \(\frac{-2.5}{-1} = 2.5\)
- For \(x = 2\), \(y = 5.0\): \(\frac{5.0}{2} = 2.5\)
- For \(x = 5\), \(y = 12.5\): \(\frac{12.5}{5} = 2.5\)
- For \(x = 10\), \(y = 25.0\): \(\frac{25.0}{10} = 2.5\)
Since the ratio \(\frac{y}{x}\) is constantly \(2.5\) for every pair, this table represents the direct variation function \(y = 2.5x\).

Snap & solve any problem in the app
Get step-by-step solutions on Sovi AI
Photo-based solutions with guided steps
Explore more problems and detailed explanations
- (A) Table 1: x = [-3, -1, 2, 5, 10], y = [-4.5, -3.0, -1.5, 0.0, 1.5]
- (B) Table 2: x = [-5.5, -4.5, -3.5, -2.5, -1.5], y = [10, 8, 6, 4, 2]
- (C) Table 3: x = [-5.5, -5.5, -5.5, -5.5, -5.5], y = [-3, -1, 2, 5, 10]
- (D) Table 4: x = [-3, -1, 2, 5, 10], y = [-7.5, -2.5, 5.0, 12.5, 25.0] (Correct answer)