QUESTION IMAGE
Question
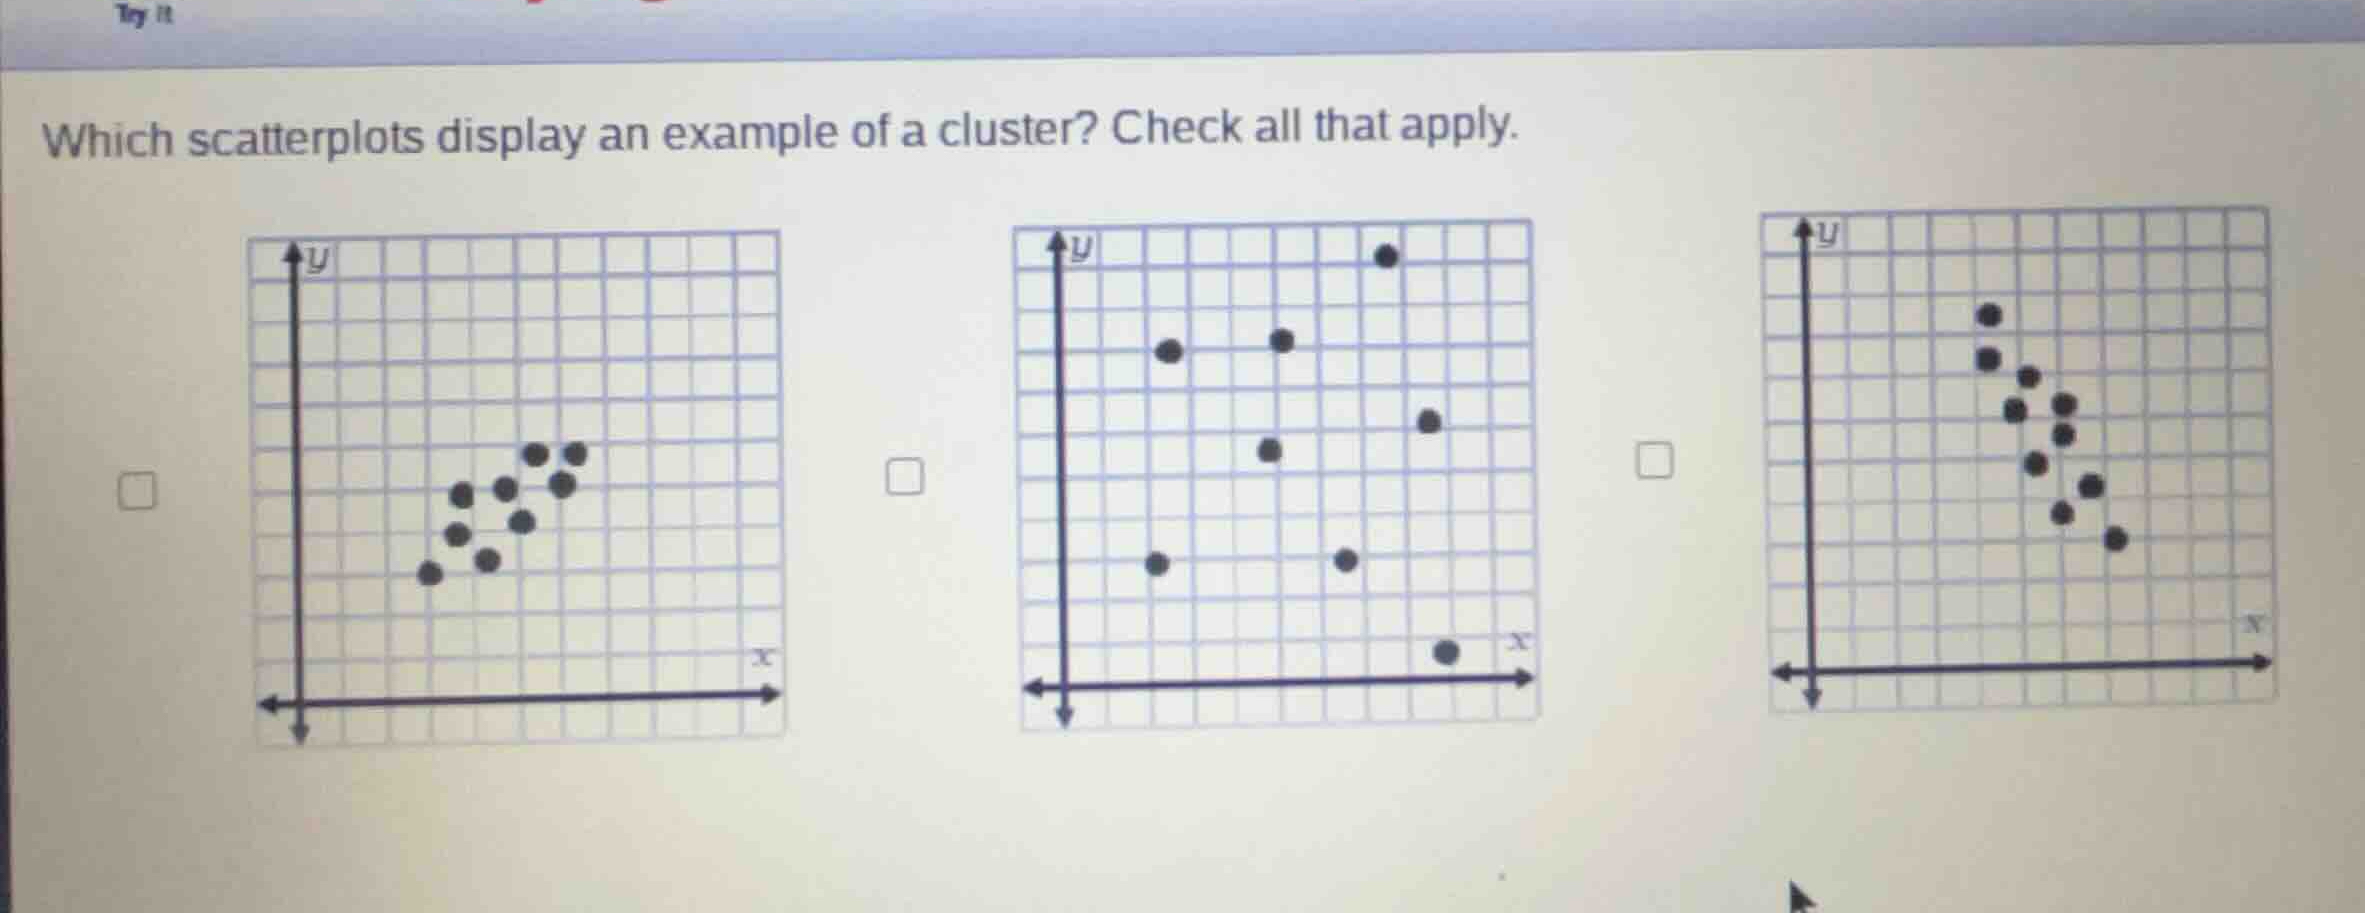
which scatterplots display an example of a cluster? check all that apply.
Define a cluster in a scatterplot
A cluster is a distinct group of data points that are gathered closely together in a specific region of the graph, showing a high density compared to other areas.
Analyze each scatterplot
- First scatterplot (left): The data points are tightly grouped together in a single, dense region. This represents a clear cluster.
- Second scatterplot (middle): The data points are widely scattered and spread out across the entire grid with no dense grouping. This does not show a cluster.
- Third scatterplot (right): The data points are tightly grouped together in a single, dense region forming a downward trend. This represents a clear cluster.

Snap & solve any problem in the app
Get step-by-step solutions on Sovi AI
Photo-based solutions with guided steps
Explore more problems and detailed explanations
- (A) The first scatterplot (left) (Correct answer)
- (B) The second scatterplot (middle)
- (C) The third scatterplot (right) (Correct answer)