QUESTION IMAGE
Question
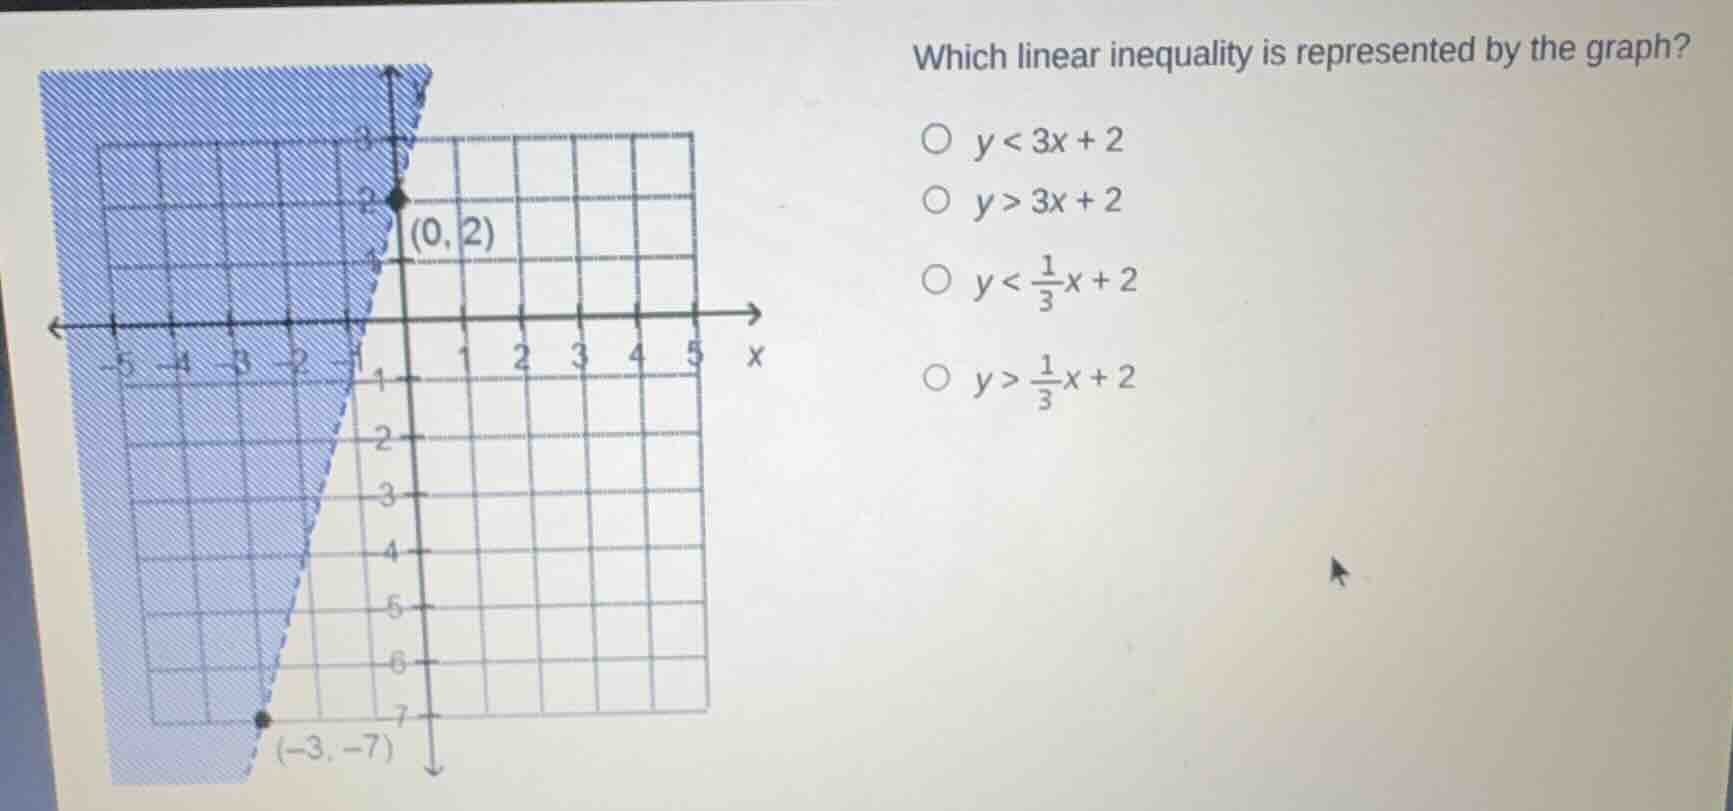
which linear inequality is represented by the graph?
options:
- $y < 3x + 2$
- $y > 3x + 2$
- $y < \frac{1}{3}x + 2$
- $y > \frac{1}{3}x + 2$
graph has points (0, 2) and (-3, -7), shaded region, grid with x from -5 to 5 and y from -7 to 3.
Step1: Find the slope of the line
The line passes through \((0, 2)\) and \((-3, -7)\). The slope \(m\) is calculated as \(m=\frac{y_2 - y_1}{x_2 - x_1}=\frac{-7 - 2}{-3 - 0}=\frac{-9}{-3}=3\). So the equation of the line is \(y = 3x+2\) (since the y - intercept \(b = 2\) from the point \((0,2)\)).
Step2: Determine the inequality symbol
The line is dashed (wait, no, looking at the graph, the line is solid? Wait, no, the points \((0,2)\) and \((-3,-7)\) are on the line. Wait, the shaded region: let's test a point. Let's take a point in the shaded region, say \((-3,0)\). Plug into the line equation \(y = 3x + 2\), when \(x=-3\), \(y=3\times(-3)+2=-9 + 2=-7\). The shaded region is above or below? Wait, the shaded region includes points where \(y\) is greater than the line? Wait, no, let's check the inequality. Wait, the line is \(y = 3x+2\). Let's take the point \((0,3)\) (above the line \(y = 3x + 2\) at \(x = 0\), \(y=2\)). Wait, no, the shaded region: looking at the graph, the shaded area is to the left of the line. Wait, let's use the slope. Wait, the two points are \((0,2)\) and \((-3,-7)\). The slope is 3, so the line is steep. Now, the inequality: the line is dashed or solid? Wait, the points \((0,2)\) and \((-3,-7)\) are on the line, but the shaded region: let's check the inequality direction. Let's take a point in the shaded region, say \((-1,0)\). Plug into \(y=3x + 2\): \(y=3\times(-1)+2=-1\). So \(0>-1\), so \(y>3x + 2\)? Wait, no, wait \((-1,0)\): \(0\) compared to \(3\times(-1)+2=-1\). So \(0>-1\), so \(y>3x + 2\)? Wait, but let's check the options. Wait, the line equation is \(y = 3x+2\). Now, the shaded region: if we look at the graph, the shaded area is above the line? Wait, no, the graph shows the shaded region on the left side. Wait, maybe I made a mistake in slope. Wait, no, the two points: \((0,2)\) and \((-3,-7)\). Slope is \(\frac{-7 - 2}{-3 - 0}=3\), correct. Now, the inequality: the line is solid? Wait, the points \((0,2)\) and \((-3,-7)\) are on the line, but the shaded region: let's see, the line is \(y = 3x+2\). The shaded area: let's take \(x = 0\), the shaded area is above \(y = 2\)? Wait, no, at \(x = 0\), the line is \(y = 2\), and the shaded area is above \(y = 2\)? Wait, no, the point \((0,3)\) is in the shaded region? Wait, no, the graph's shaded region: looking at the grid, the shaded area is to the left of the line. Wait, maybe I messed up the slope. Wait, no, let's recalculate the slope. \(m=\frac{-7 - 2}{-3 - 0}=\frac{-9}{-3}=3\), that's correct. So the line is \(y = 3x+2\). Now, the shaded region: let's check the inequality. If we take a point in the shaded region, say \((-2,0)\). Plug into \(y=3x + 2\): \(y=3\times(-2)+2=-6 + 2=-4\). So \(0>-4\), so \(y>3x + 2\). Also, the line is dashed? Wait, no, the points \((0,2)\) and \((-3,-7)\) are on the line, but the line in the graph: is it a dashed or solid line? The options have \(y>3x + 2\) and \(y<3x + 2\). Wait, the shaded region: if the line is \(y = 3x+2\), and the shaded area is above the line, then the inequality is \(y>3x + 2\). Also, the line is dashed? Wait, the graph shows the line as a solid line? Wait, no, the points \((0,2)\) and \((-3,-7)\) are on the line, but the shaded region: let's confirm with the options. The options are \(y<3x + 2\), \(y>3x + 2\), \(y<\frac{1}{3}x + 2\), \(y>\frac{1}{3}x + 2\). We found the slope is 3, so the line is \(y = 3x+2\). Now, the shaded region: since when we test a point in the shaded area, \(y\) is greater than \(3x + 2\) (as seen from the point \((-2,0)\) where \(0>3\times(-2)+2=-4\)), so the ine…

Snap & solve any problem in the app
Get step-by-step solutions on Sovi AI
Photo-based solutions with guided steps
Explore more problems and detailed explanations
\(y>3x + 2\) (the second option: \(y>3x + 2\))