QUESTION IMAGE
Question
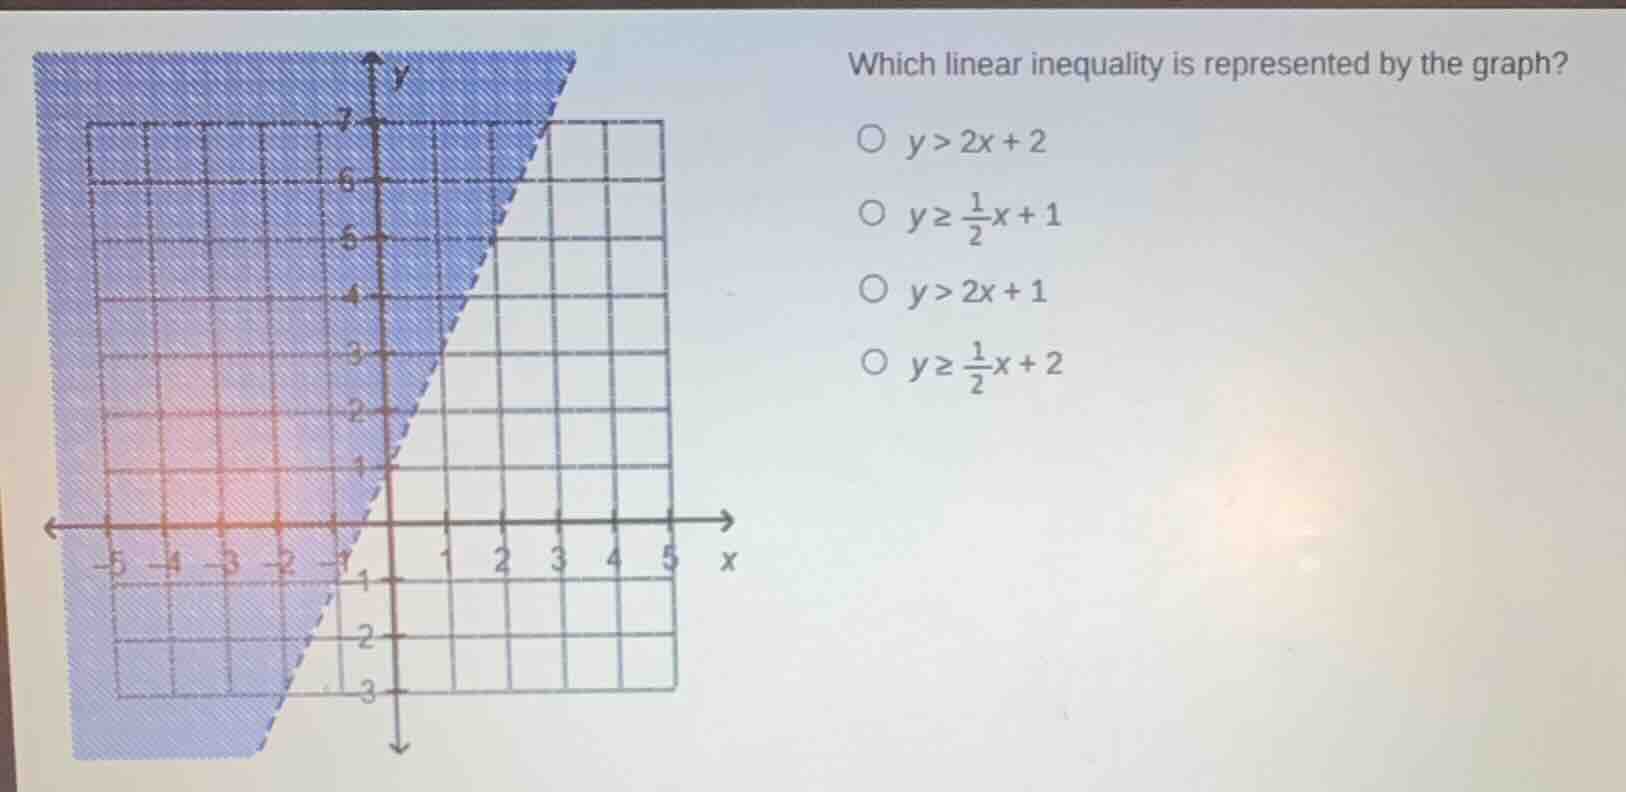
which linear inequality is represented by the graph?
- $y > 2x + 2$
- $y \geq \frac{1}{2}x + 1$
- $y > 2x + 1$
- $y \geq \frac{1}{2}x + 2$
Step1: Determine the slope and y-intercept
First, identify two points on the boundary line. From the graph, the line passes through (0, 2) and (2, 3). The slope \( m \) is calculated as \( \frac{3 - 2}{2 - 0} = \frac{1}{2} \). The y-intercept \( b \) is 2 (since it crosses the y-axis at (0, 2)).
Step2: Analyze the line type and inequality sign
The boundary line is solid (since the shaded region includes the line), so the inequality should have \( \geq \) or \( \leq \). The shaded region is above the line, so we use \( \geq \). The equation of the line is \( y = \frac{1}{2}x + 2 \), so the inequality is \( y \geq \frac{1}{2}x + 2 \).

Snap & solve any problem in the app
Get step-by-step solutions on Sovi AI
Photo-based solutions with guided steps
Explore more problems and detailed explanations
\( y \geq \frac{1}{2}x + 2 \)