QUESTION IMAGE
Question
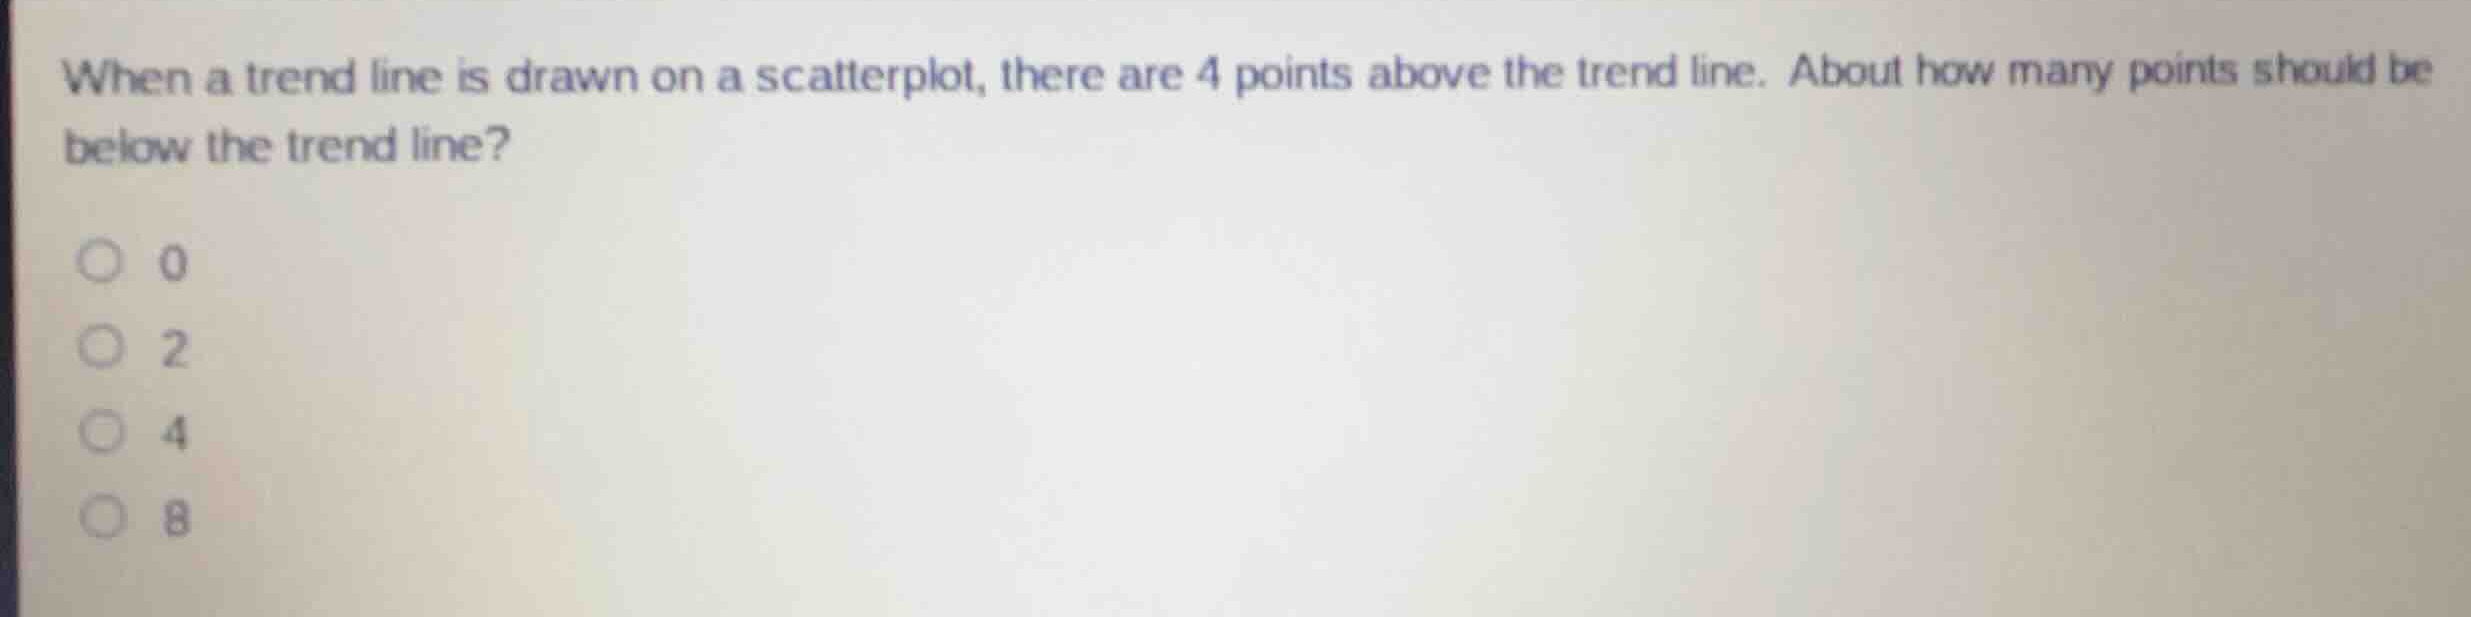
when a trend line is drawn on a scatterplot, there are 4 points above the trend line. about how many points should be below the trend line?
0
2
4
8
Analyze the definition of a trend line
A trend line (or line of best fit) on a scatterplot is drawn to represent the general direction of the data points. Ideally, a trend line should balance the data points, meaning it should have roughly an equal number of points above and below it.
Determine the number of points below the trend line
Given that there are 4 points above the trend line, to maintain a balanced distribution of points on either side of the line, there should be approximately the same number of points below it.
$$
\text{Points below} \approx \text{Points above} = 4
$$

Snap & solve any problem in the app
Get step-by-step solutions on Sovi AI
Photo-based solutions with guided steps
Explore more problems and detailed explanations
- 0
- 2
- 4 (Correct answer)
- 8