QUESTION IMAGE
Question
what compound inequality describes this graph?
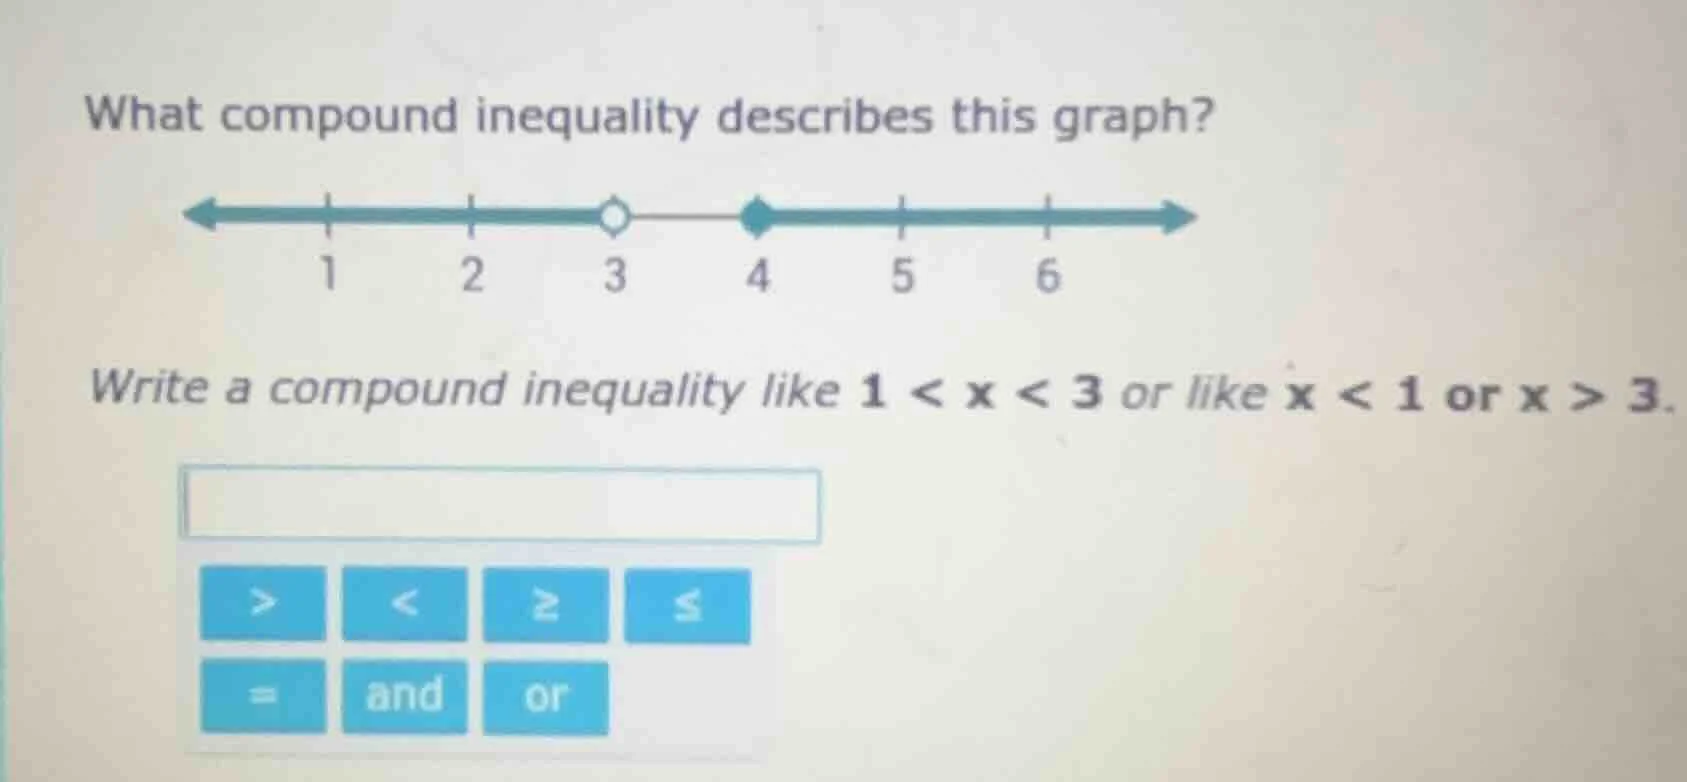
(number line with 1, 2, 3 (open circle), 4 (closed circle), 5, 6 marked. arrows left from 3 and right from 4.)
write a compound inequality like 1 < x < 3 or like x < 1 or x > 3.
Step1: Analyze the open circle at 3
An open circle at 3 means the solution does not include 3, so we have \( x < 3 \).
Step2: Analyze the closed circle at 4
A closed circle at 4 means the solution includes 4, so we have \( x \geq 4 \).
Step3: Combine the inequalities
Since the graph shows two separate regions (left of 3 and right of/including 4), we use "or" to combine them. So the compound inequality is \( x < 3 \) or \( x \geq 4 \).

Snap & solve any problem in the app
Get step-by-step solutions on Sovi AI
Photo-based solutions with guided steps
Explore more problems and detailed explanations
\( x < 3 \) or \( x \geq 4 \)