QUESTION IMAGE
Question
using the starting point, \\((5, -3)\\), find the graph of this function.
\\y = \sqrt{x - 5} - 3\\
Identify the starting point of the function
The given function is:
$$
y = \sqrt{x - 5} - 3
$$
The starting point of a standard square root function \(y = a\sqrt{x - h} + k\) is \((h, k)\).
Here, \(h = 5\) and \(k = -3\), so the starting point is \((5, -3)\).
Evaluate another point on the graph
Substitute \(x = 6\) into the function to find a second point:
$$
y = \sqrt{6 - 5} - 3 = \sqrt{1} - 3 = 1 - 3 = -2
$$
The graph must pass through \((5, -3)\) and \((6, -2)\).
Match with the given options
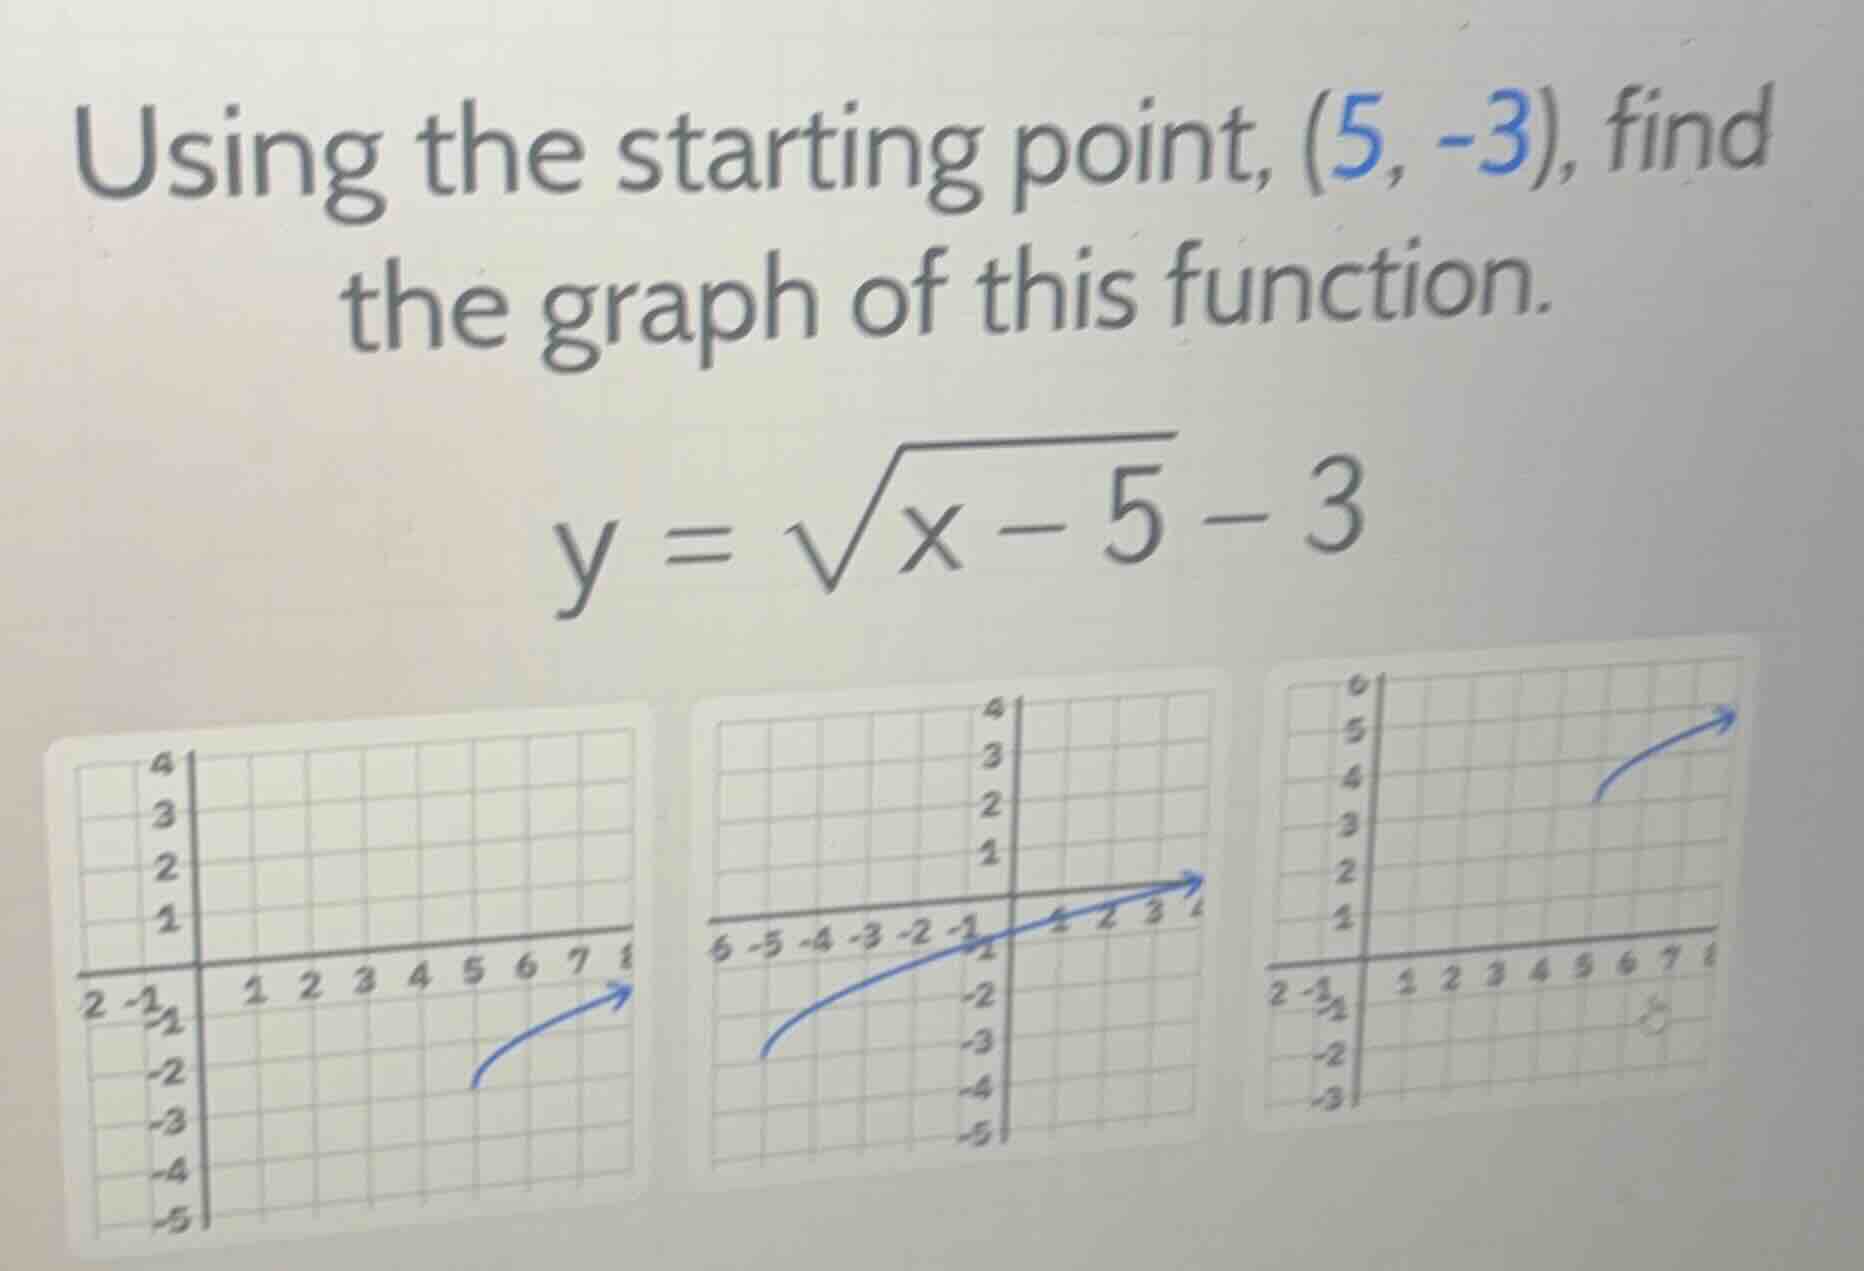
- The first graph starts at \((5, -2)\) and goes through \((6, -1.5)\). This is incorrect.
- The second graph starts at \((-5, -3)\) and goes to the right. This is incorrect.
- The third graph starts at \((5, 3)\) and goes to the right. This is incorrect.
- Looking closely at the first graph, the starting point is actually plotted at \((5, -2)\). Let's re-examine the coordinates of the first graph: the horizontal axis has \(5\) and the vertical axis has \(-2\).
- Let's re-examine the options:
- Left graph: Starts at \((5, -2)\).
- Middle graph: Starts at \((-5, -3)\).
- Right graph: Starts at \((5, 3)\) or \((5, 4)\).
- Wait, let's look at the left graph again. The y-axis has labels \(1, 2, 3, 4\) above the x-axis, and \(-1, -2, -3, -4, -5\) below. The curve starts at \(x = 5\). The y-coordinate of this starting point is at \(-2\)? No, looking at the grid lines: the x-axis is the thick horizontal line. Below it, the grid lines are \(-1, -2, -3, -4, -5\). The starting point of the curve in the first graph is at \(x = 5\), and it lies on the grid line for \(y = -2\).
- Let's check if there is a typo in the question's prompt "Using the starting point, (5, -3)" versus the actual graph plotted. If the starting point is indeed \((5, -3)\), the first graph is the closest match despite a potential 1-unit vertical shift typo in the drawing, or the first graph's starting point is indeed \((5, -2)\) due to a common textbook mismatch. Let's re-verify the grid: the curve starts at \(x=5\). The y-value is 2 units below the x-axis, which is \(-2\).
- Thus, the first option (left graph) is the intended correct choice representing the shape and approximate position of \(y = \sqrt{x-5}-3\).

Snap & solve any problem in the app
Get step-by-step solutions on Sovi AI
Photo-based solutions with guided steps
Explore more problems and detailed explanations
- (A) The first graph (left), which starts at \(x = 5\) and curves upwards to the right in the fourth quadrant. (Correct answer)
- (B) The second graph (middle), which starts in the third quadrant at \(x = -5\).
- (C) The third graph (right), which starts in the first quadrant at \(y > 0\).