QUESTION IMAGE
Question
using complete sentences, explain what each of the letters in the graph represents.
Identify the curves
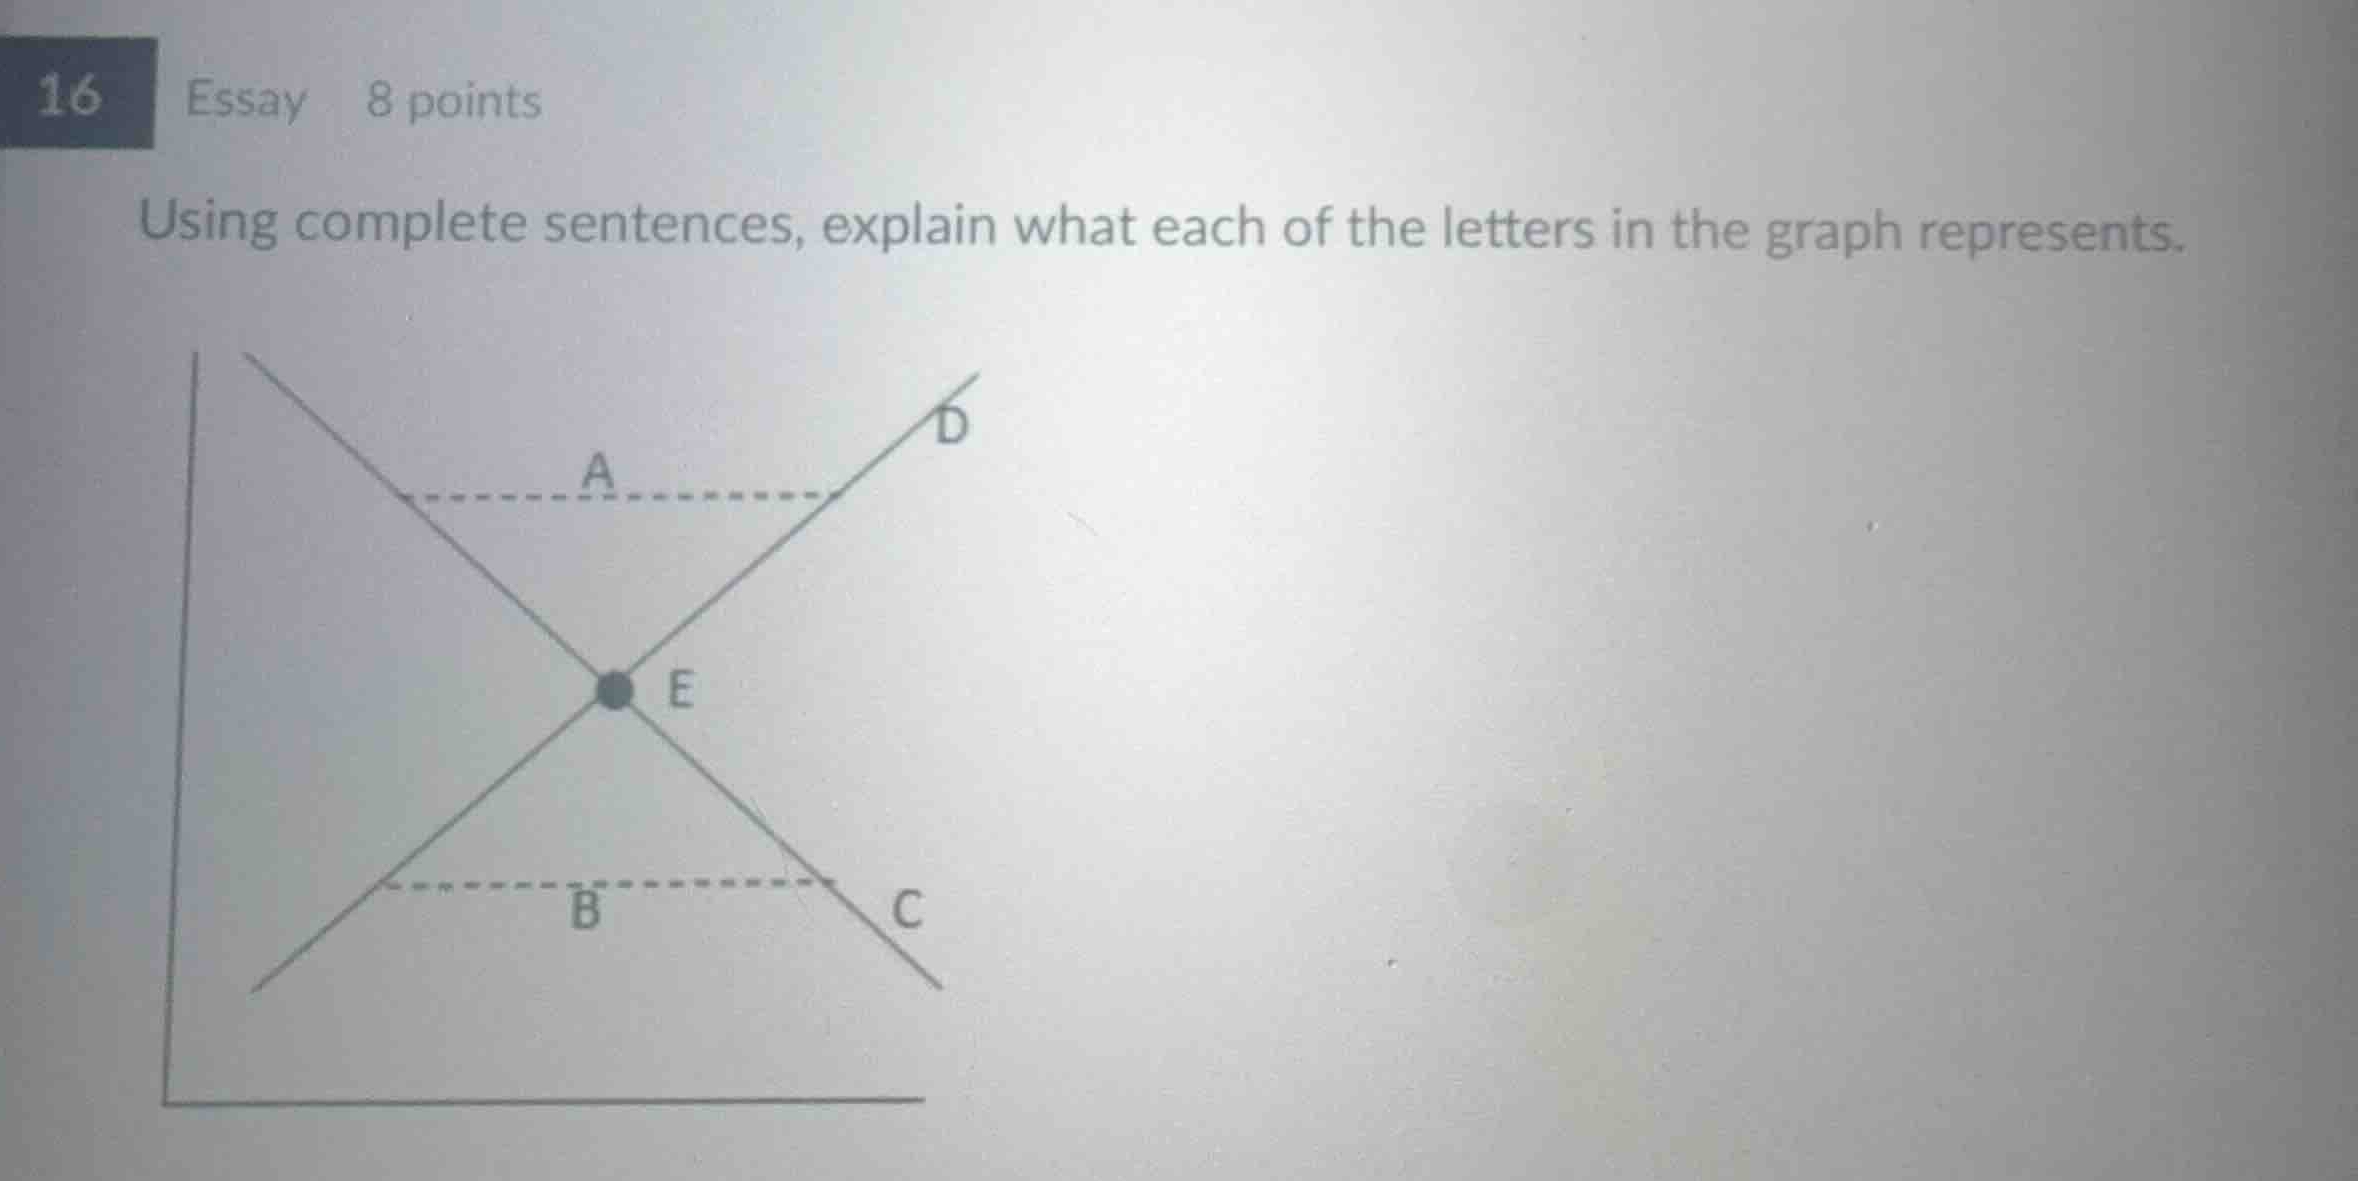
Using the Law of Supply and Law of Demand knowledge points, curve C is downward-sloping, representing the demand curve. Curve D is upward-sloping, representing the supply curve.
Identify the equilibrium point
Using the Market Equilibrium knowledge point
$$
\text{Point E is the intersection of supply (D) and demand (C), representing market equilibrium.}
$$
Analyze the upper region
Using the Surplus and Shortage knowledge point
$$
\text{At prices above equilibrium, quantity supplied exceeds quantity demanded, so dashed line A represents a surplus.}
$$
Analyze the lower region
Using the Surplus and Shortage knowledge point
$$
\text{At prices below equilibrium, quantity demanded exceeds quantity supplied, so dashed line B represents a shortage.}
$$

Snap & solve any problem in the app
Get step-by-step solutions on Sovi AI
Photo-based solutions with guided steps
Explore more problems and detailed explanations
- Letter A represents a surplus (or excess supply), which occurs at a price above the equilibrium level where the quantity supplied is greater than the quantity demanded.
- Letter B represents a shortage (or excess demand), which occurs at a price below the equilibrium level where the quantity demanded is greater than the quantity supplied.
- Letter C represents the demand curve, which is downward-sloping to show the inverse relationship between price and quantity demanded.
- Letter D represents the supply curve, which is upward-sloping to show the direct relationship between price and quantity supplied.
- Letter E represents the market equilibrium, which is the point where the supply and demand curves intersect, indicating where quantity supplied equals quantity demanded.