QUESTION IMAGE
Question
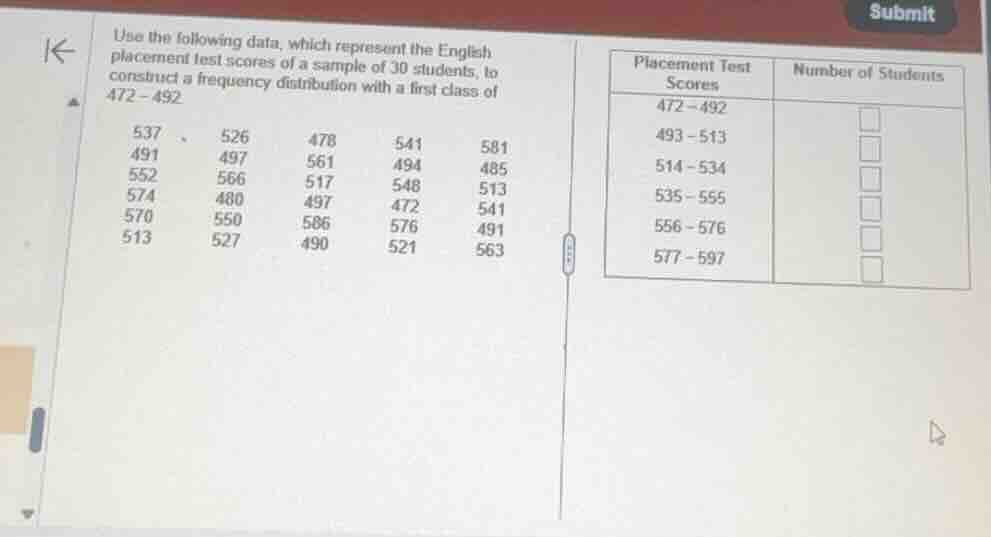
use the following data, which represent the english placement test scores of a sample of 30 students, to construct a frequency distribution with a first class of 472-492.
537, 526, 478, 541, 581
491, 497, 561, 494, 485
552, 566, 517, 548, 513
574, 480, 497, 472, 541
570, 550, 586, 576, 491
513, 527, 490, 521, 563
| placement test scores | number of students |
|---|---|
| 493-513 | |
| 514-534 | |
| 535-555 | |
| 556-576 | |
| 577-597 |
⚡ Using what you learned: Organizing Data in Tables
Step 1: Sort the raw data
To accurately count the frequencies for each class, we first list the 30 data points in ascending order:
\[
472, 478, 480, 485, 490, 491, 491, 494, 497, 497, 513, 513, 517, 521, 526, 527, 537, 541, 541, 548, 550, 552, 561, 563, 566, 570, 574, 576, 581, 586
\]
Step 2: Count frequencies for each class interval
- Class \(472 - 492\):
Values: \(472, 478, 480, 485, 490, 491, 491\)
Count: \(7\)
- Class \(493 - 513\):
Values: \(494, 497, 497, 513, 513\)
Count: \(5\)
- Class \(514 - 534\):
Values: \(517, 521, 526, 527\)
Count: \(4\)
- Class \(535 - 555\):
Values: \(537, 541, 541, 548, 550, 552\)
Count: \(6\)
- Class \(556 - 576\):
Values: \(561, 563, 566, 570, 574, 576\)
Count: \(6\)
- Class \(577 - 597\):
Values: \(581, 586\)
Count: \(2\)
Step 3: Verify total count
\[
7 + 5 + 4 + 6 + 6 + 2 = 30
\]
The sum matches the sample size of 30 students.

Snap & solve any problem in the app
Get step-by-step solutions on Sovi AI
Photo-based solutions with guided steps
Explore more problems and detailed explanations
| Placement Test Scores | Number of Students |
|---|---|
| 493–513 | 5 |
| 514–534 | 4 |
| 535–555 | 6 |
| 556–576 | 6 |
| 577–597 | 2 |