QUESTION IMAGE
Question
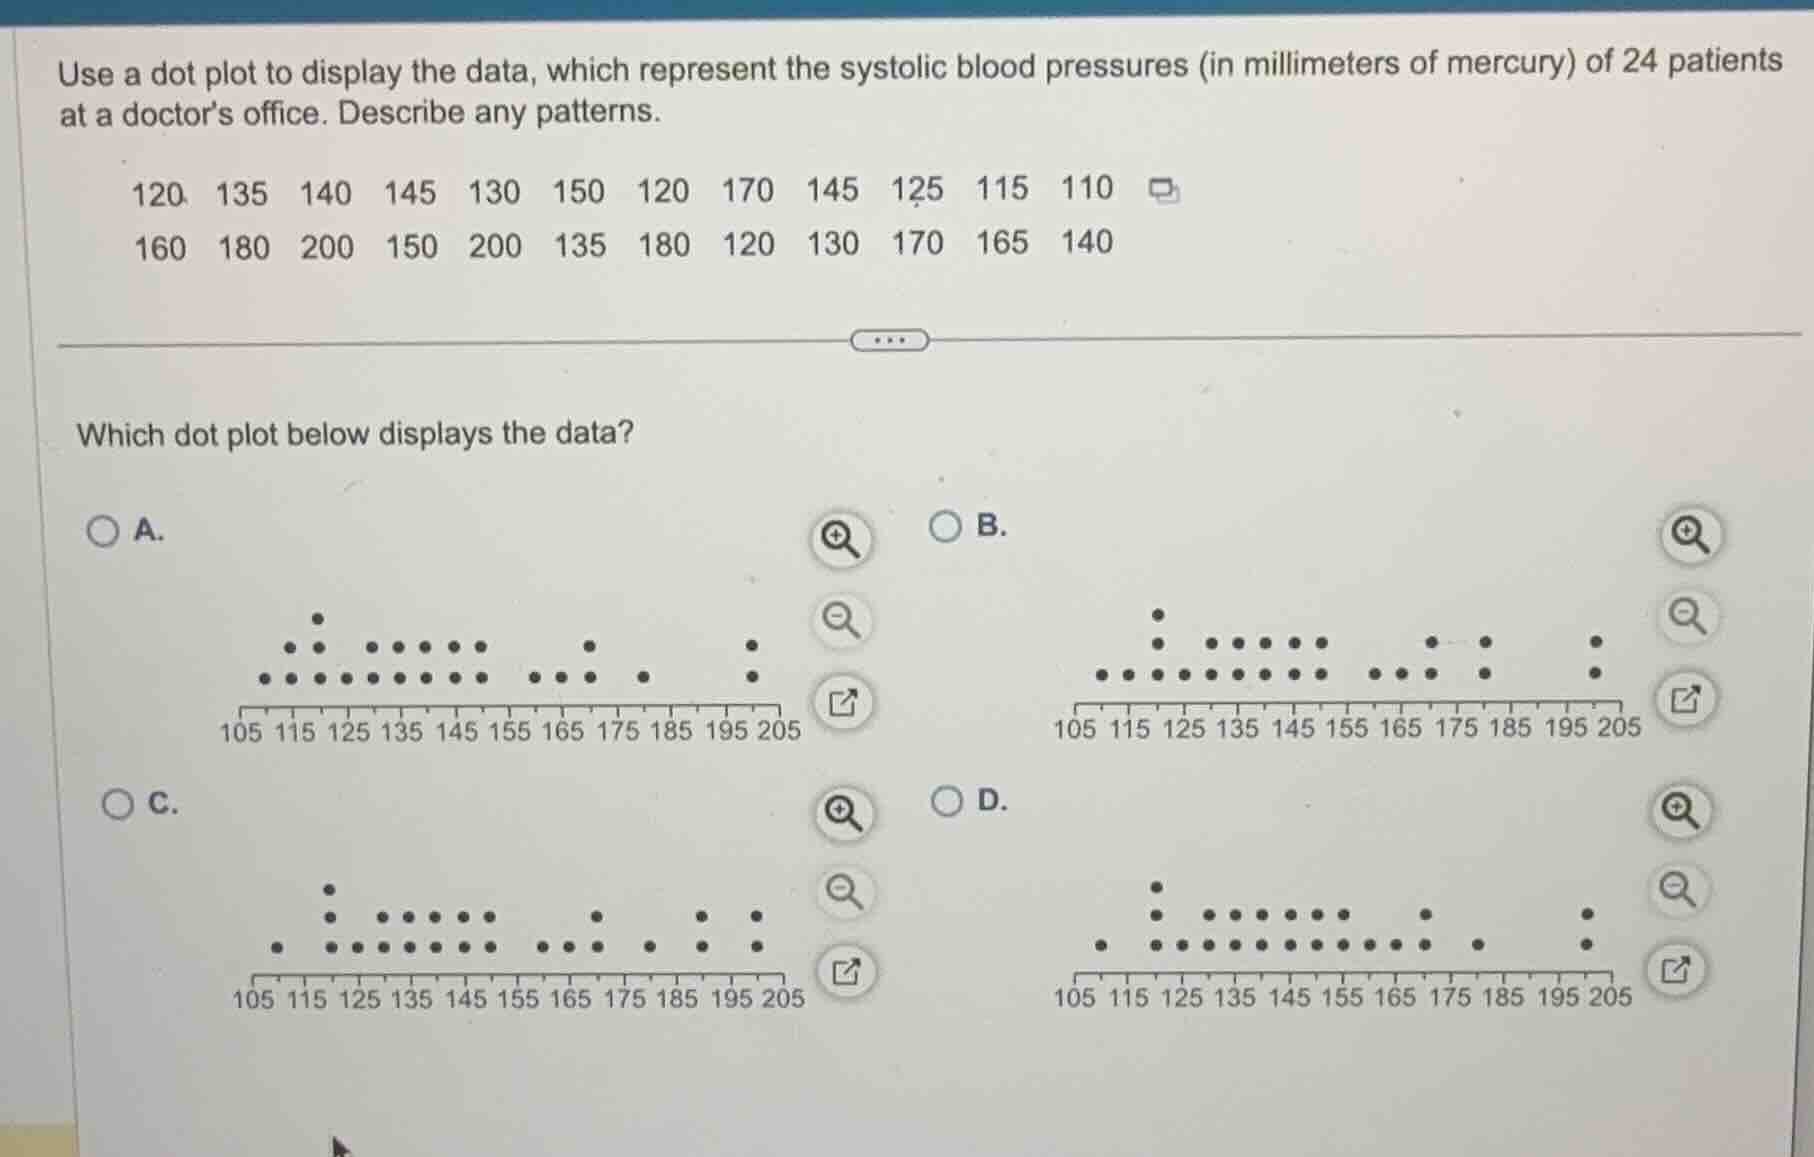
use a dot plot to display the data, which represent the systolic blood pressures (in millimeters of mercury) of 24 patients at a doctors office. describe any patterns.
120 135 140 145 130 150 120 170 145 125 115 110
160 180 200 150 200 135 180 120 130 170 165 140
which dot plot below displays the data?
Count the frequency of each data value
The dataset consists of 24 values:
110: 1
115: 1
120: 3
125: 1
130: 2
135: 2
140: 2
145: 2
150: 2
160: 1
165: 1
170: 2
180: 2
200: 2
Compare frequencies with the options
- At 120, there must be 3 dots.
- At 130, 135, 140, 145, 150, there must be 2 dots each.
- At 170, there must be 2 dots.
- At 180, there must be 2 dots.
- At 200, there must be 2 dots.
Looking at the options:
- Option A: 120 has 3 dots. 130 to 150 have 2 dots each. 170 has 1 dot. 180 has 1 dot. 200 has 2 dots. (Incorrect)
- Option B: 120 has 3 dots. 130 to 150 have 2 dots each. 170 has 1 dot. 180 has 2 dots. 200 has 2 dots. (Incorrect)
- Option C: 120 has 3 dots. 130 to 150 have 2 dots each. 170 has 1 dot. 180 has 2 dots. 200 has 2 dots. (Incorrect)
- Let's re-examine Option B vs C vs D:
- In Option B: 170 has 2 dots, 180 has 2 dots, 200 has 2 dots. Let's check the dots:
- 110: 1 dot
- 115: 1 dot
- 120: 3 dots
- 125: 1 dot
- 130, 135, 140, 145, 150: 2 dots each
- 160: 1 dot
- 165: 1 dot
- 170: 2 dots
- 180: 2 dots
- 200: 2 dots
- Let's look closely at Option B:
- 170 (tick mark between 165 and 175): has 2 dots.
- 180 (tick mark between 175 and 185): has 2 dots.
- 200 (tick mark between 195 and 205): has 2 dots.
- This matches our frequency count perfectly.

Snap & solve any problem in the app
Get step-by-step solutions on Sovi AI
Photo-based solutions with guided steps
Explore more problems and detailed explanations
- (A) Dot plot with incorrect frequencies at 170 and 180
- (B) Dot plot with correct frequencies for all values, including 3 dots at 120, and 2 dots at 130, 135, 140, 145, 150, 170, 180, and 200 (Correct answer)
- (C) Dot plot with incorrect frequencies
- (D) Dot plot with incorrect frequencies