QUESTION IMAGE
Question
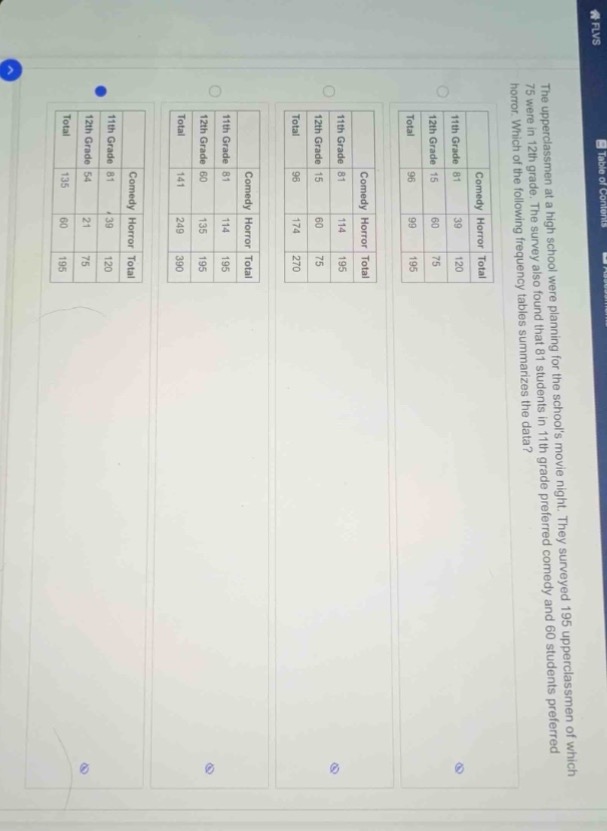
the upperclassmen at a high school were planning for the schools movie night. they surveyed 195 upperclassmen of which 75 were in 12th grade. the survey also found that 81 students in 11th grade preferred comedy and 60 students preferred horror. which of the following frequency tables summarizes the data?
Identify given marginal and joint frequencies
$$
LATEXBLOCK0
$$
Calculate remaining joint frequencies
$$
LATEXBLOCK1
$$
Match with the options
$$
LATEXBLOCK2
$$
This matches the fourth option (marked with the blue selection dot on the far left).

Snap & solve any problem in the app
Get step-by-step solutions on Sovi AI
Photo-based solutions with guided steps
Explore more problems and detailed explanations
- (A) Table with 11th Grade (81 Comedy, 39 Horror, 120 Total), 12th Grade (15 Comedy, 60 Horror, 75 Total), Total (96 Comedy, 99 Horror, 195 Total)
- (B) Table with 11th Grade (81 Comedy, 114 Horror, 195 Total), 12th Grade (15 Comedy, 60 Horror, 75 Total), Total (96 Comedy, 174 Horror, 270 Total)
- (C) Table with 11th Grade (81 Comedy, 114 Horror, 195 Total), 12th Grade (60 Comedy, 135 Horror, 195 Total), Total (141 Comedy, 249 Horror, 390 Total)
- (D) Table with 11th Grade (81 Comedy, 39 Horror, 120 Total), 12th Grade (54 Comedy, 21 Horror, 75 Total), Total (135 Comedy, 60 Horror, 195 Total) (Correct answer)