QUESTION IMAGE
Question
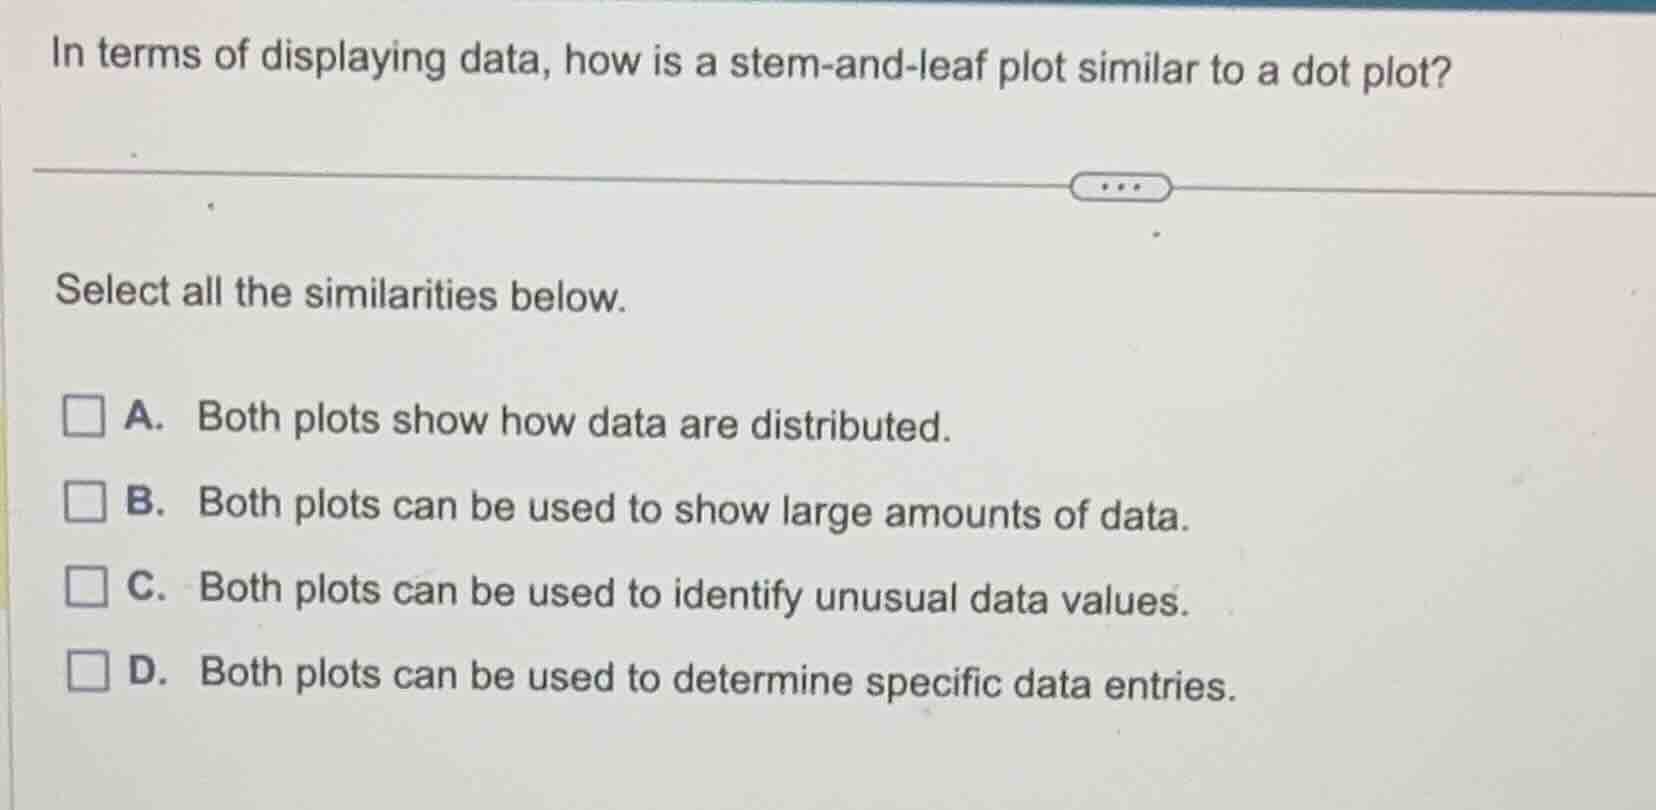
in terms of displaying data, how is a stem-and-leaf plot similar to a dot plot?
select all the similarities below.
a. both plots show how data are distributed.
b. both plots can be used to show large amounts of data.
c. both plots can be used to identify unusual data values.
d. both plots can be used to determine specific data entries.
Analyze the characteristics of stem-and-leaf plots and dot plots
- Both plots display the shape and distribution of a dataset.
- Both plots are typically used for small to moderate datasets; they become cluttered and impractical for very large amounts of data.
- Both plots allow for the visual identification of outliers or unusual data values.
- Both plots preserve the individual raw data values, meaning specific data entries can be recovered directly from the display.
Evaluate the given options
- Option A: True. Both show the distribution of the data.
- Option B: False. Neither is well-suited for very large datasets.
- Option C: True. Both make it easy to spot outliers or unusual values.
- Option D: True. Both allow you to retrieve the exact original data values.

Snap & solve any problem in the app
Get step-by-step solutions on Sovi AI
Photo-based solutions with guided steps
Explore more problems and detailed explanations
- A. Both plots show how data are distributed. (Correct answer)
- B. Both plots can be used to show large amounts of data.
- C. Both plots can be used to identify unusual data values. (Correct answer)
- D. Both plots can be used to determine specific data entries. (Correct answer)