QUESTION IMAGE
Question
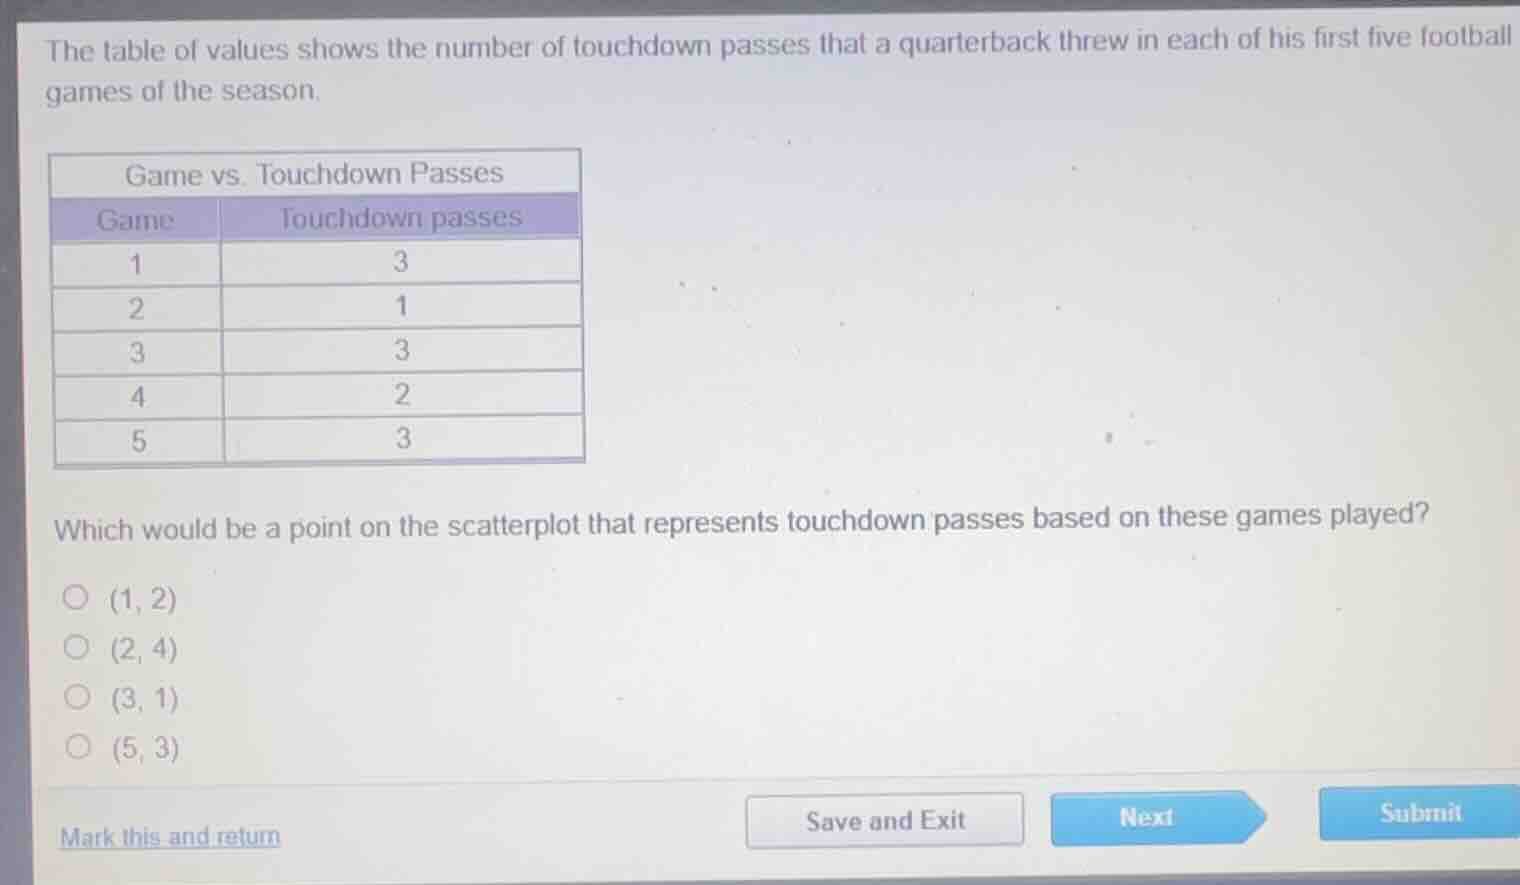
the table of values shows the number of touchdown passes that a quarterback threw in each of his first five football games of the season.
game vs. touchdown passes
\
which would be a point on the scatterplot that represents touchdown passes based on these games played?
(1, 2)
(2, 4)
(3, 1)
(5, 3)
Identify the independent and dependent variables
Using the Scatterplot Analysis knowledge point
The independent variable \(x\) represents the "Game" number, and the dependent variable \(y\) represents the "Touchdown passes" thrown in that game. Each data point on the scatterplot is represented as an ordered pair \((x, y)\).
Extract the data points from the table
Using the Scatterplot Analysis knowledge point
From the given table, we can list the ordered pairs \((x, y)\) for each of the five games:
- Game 1: \(3\) passes \(
ightarrow (1, 3)\)
- Game 2: \(1\) pass \(
ightarrow (2, 1)\)
- Game 3: \(3\) passes \(
ightarrow (3, 3)\)
- Game 4: \(2\) passes \(
ightarrow (4, 2)\)
- Game 5: \(3\) passes \(
ightarrow (5, 3)\)
Compare with the given options
Using the Scatterplot Analysis knowledge point
We compare our set of actual data points \(\{(1, 3), (2, 1), (3, 3), (4, 2), (5, 3)\}\) with the multiple-choice options:
- \((1, 2)\): Not in our set.
- \((2, 4)\): Not in our set.
- \((3, 1)\): Not in our set.
- \((5, 3)\): This matches the data point from Game 5.

Snap & solve any problem in the app
Get step-by-step solutions on Sovi AI
Photo-based solutions with guided steps
Explore more problems and detailed explanations
- (A) (1, 2)
- (B) (2, 4)
- (C) (3, 1)
- (D) (5, 3) (Correct answer)