QUESTION IMAGE
Question
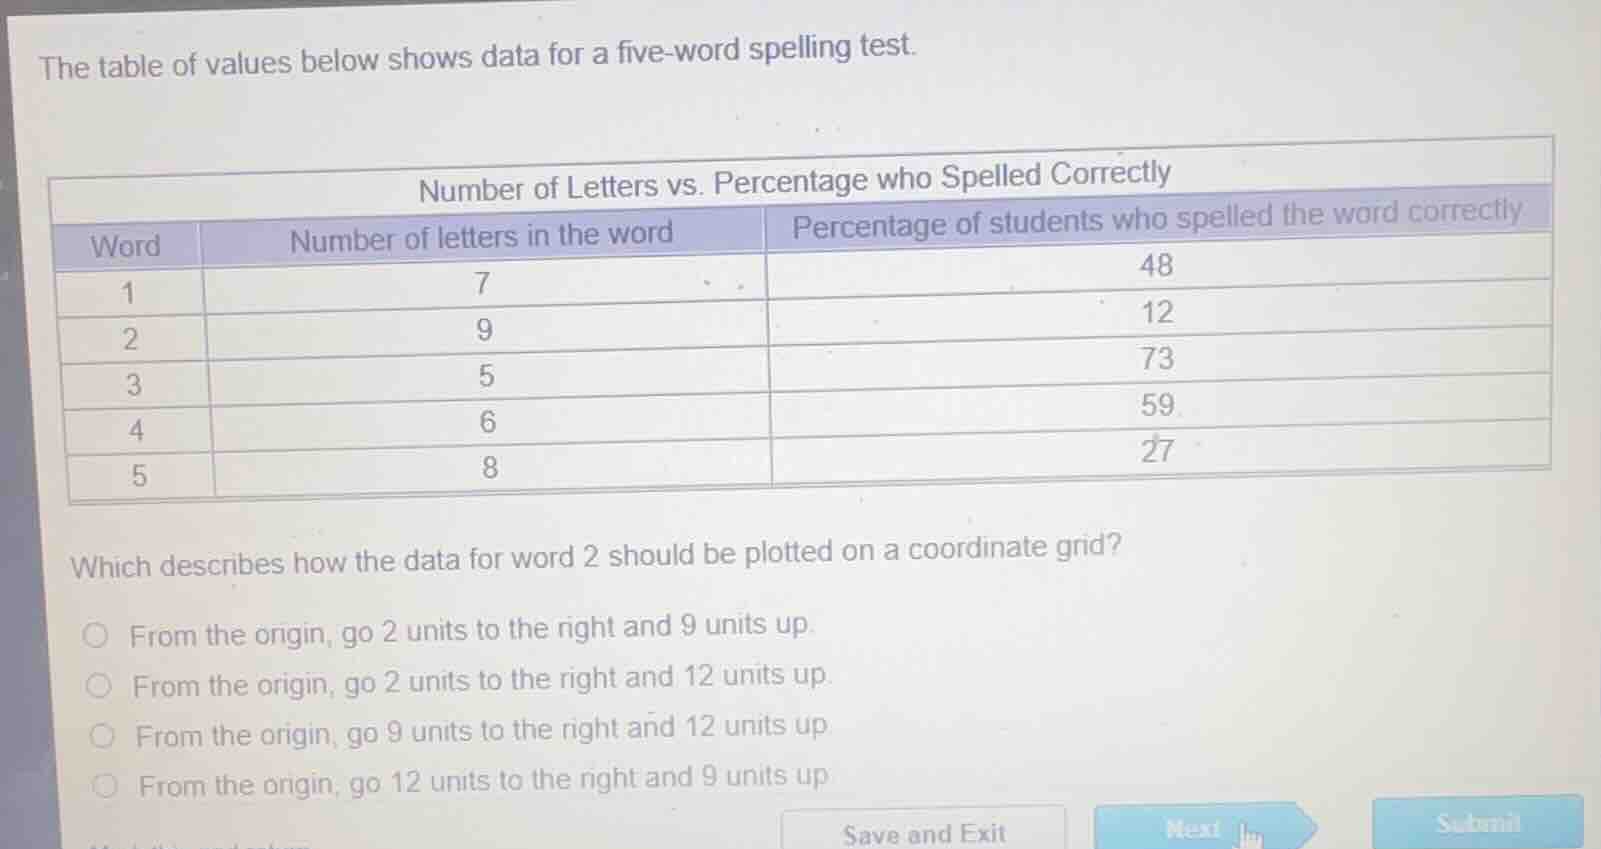
the table of values below shows data for a five-word spelling test.
number of letters vs. percentage who spelled correctly
word | number of letters in the word | percentage of students who spelled the word correctly
1 | 7 | 48
2 | 9 | 12
3 | 5 | 73
4 | 6 | 59
5 | 8 | 27
which describes how the data for word 2 should be plotted on a coordinate grid?
from the origin, go 2 units to the right and 9 units up.
from the origin, go 2 units to the right and 12 units up.
from the origin, go 9 units to the right and 12 units up.
from the origin, go 12 units to the right and 9 units up.
Identify the data for word 2
Using the Data Point Representation knowledge point
The table shows the following values for Word 2:
- Word number: \(2\)
- Number of letters in the word (\(x\)-axis variable): \(9\)
- Percentage of students who spelled the word correctly (\(y\)-axis variable): \(12\)
Determine the coordinate pair
Using the Data Point Representation knowledge point
The independent variable is the number of letters in the word, and the dependent variable is the percentage of students who spelled it correctly.
Thus, the coordinate pair \((x, y)\) is:
Describe the plotting steps from the origin
Using the Data Point Representation knowledge point
To plot the coordinate point \((9, 12)\) on a coordinate grid starting from the origin \((0,0)\):
- Move \(9\) units to the right along the horizontal \(x\)-axis.
- Move \(12\) units up along the vertical \(y\)-axis.

Snap & solve any problem in the app
Get step-by-step solutions on Sovi AI
Photo-based solutions with guided steps
Explore more problems and detailed explanations
- From the origin, go 2 units to the right and 9 units up.
- From the origin, go 2 units to the right and 12 units up.
- From the origin, go 9 units to the right and 12 units up. (Correct answer)
- From the origin, go 12 units to the right and 9 units up.