QUESTION IMAGE
Question
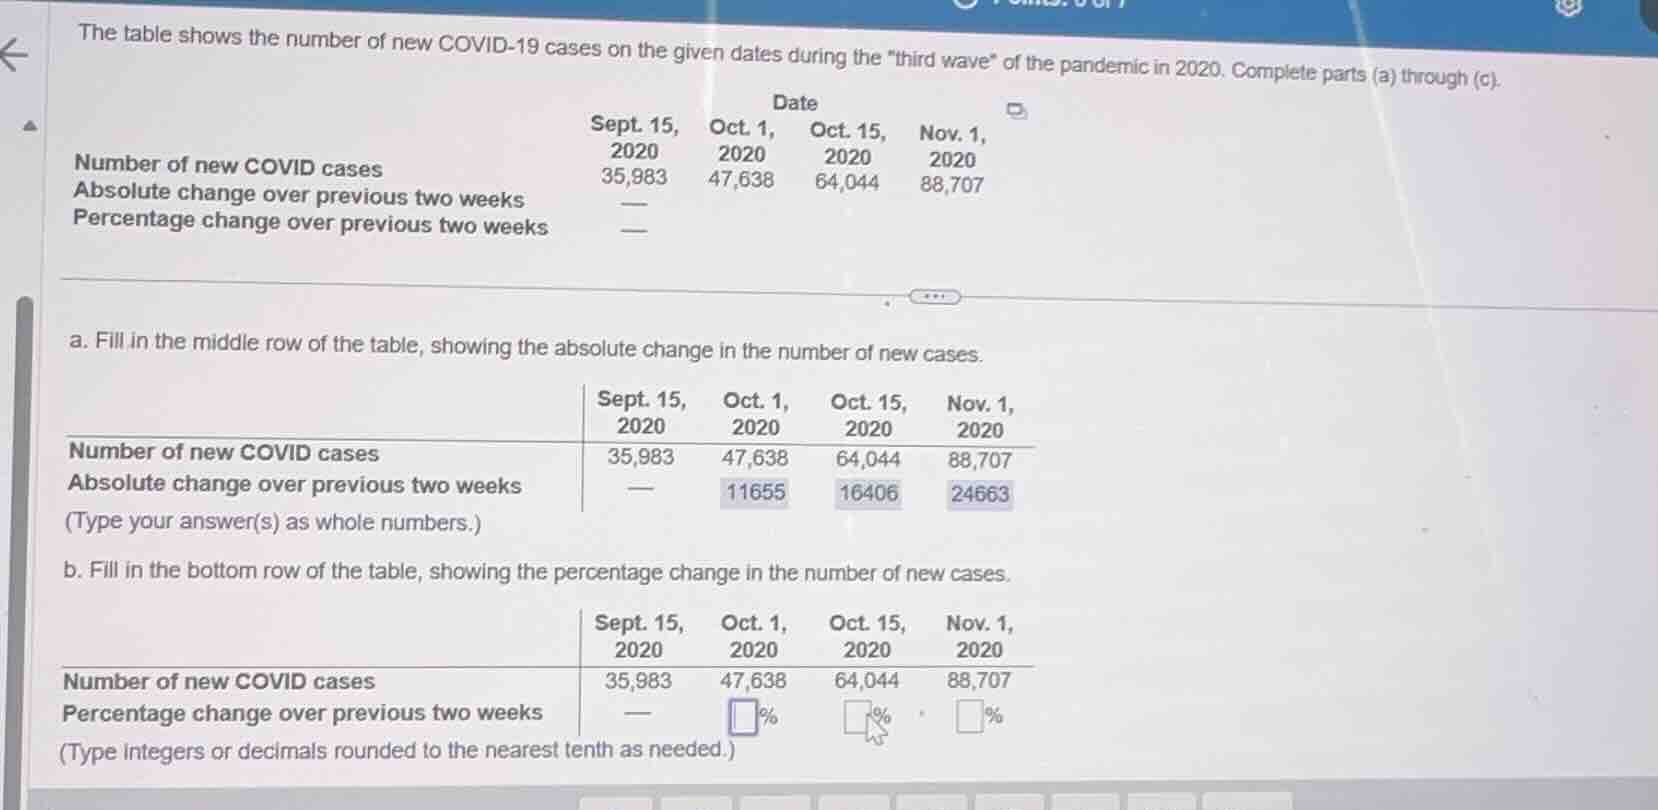
the table shows the number of new covid-19 cases on the given dates during the \third wave\ of the pandemic in 2020. complete parts (a) through (c).
date
sept. 15, 2020 | oct. 1, 2020 | oct. 15, 2020 | nov. 1, 2020
number of new covid cases: 35,983 | 47,638 | 64,044 | 88,707
absolute change over previous two weeks: —
percentage change over previous two weeks: —
a. fill in the middle row of the table, showing the absolute change in the number of new cases.
(type your answer(s) as whole numbers.)
b. fill in the bottom row of the table, showing the percentage change in the number of new cases.
(type integers or decimals rounded to the nearest tenth as needed.)
Calculate absolute changes
Using the Absolute Change knowledge point
Calculate percentage changes
Using the Percentage Change knowledge point

Snap & solve any problem in the app
Get step-by-step solutions on Sovi AI
Photo-based solutions with guided steps
Explore more problems and detailed explanations
b. Fill in the bottom row of the table, showing the percentage change in the number of new cases.
| Sept. 15, 2020 | Oct. 1, 2020 | Oct. 15, 2020 | Nov. 1, 2020 | |
|---|---|---|---|---|
| Percentage change over previous two weeks | — | <blank>32.4</blank>% | <blank>34.4</blank>% | <blank>38.5</blank>% |
(Type integers or decimals rounded to the nearest tenth as needed.)