QUESTION IMAGE
Question
summarizes why kyle is incorrect?
kyles equation has a negative y-intercept, but the scatterplot shows a point on the y-axis with a positive y-value.
kyles equation has a negative y-intercept, but the scatterplot shows a positive correlation.
kyles equation has a negative slope, but the scatterplot shows a point on the y-axis with a positive y-value.
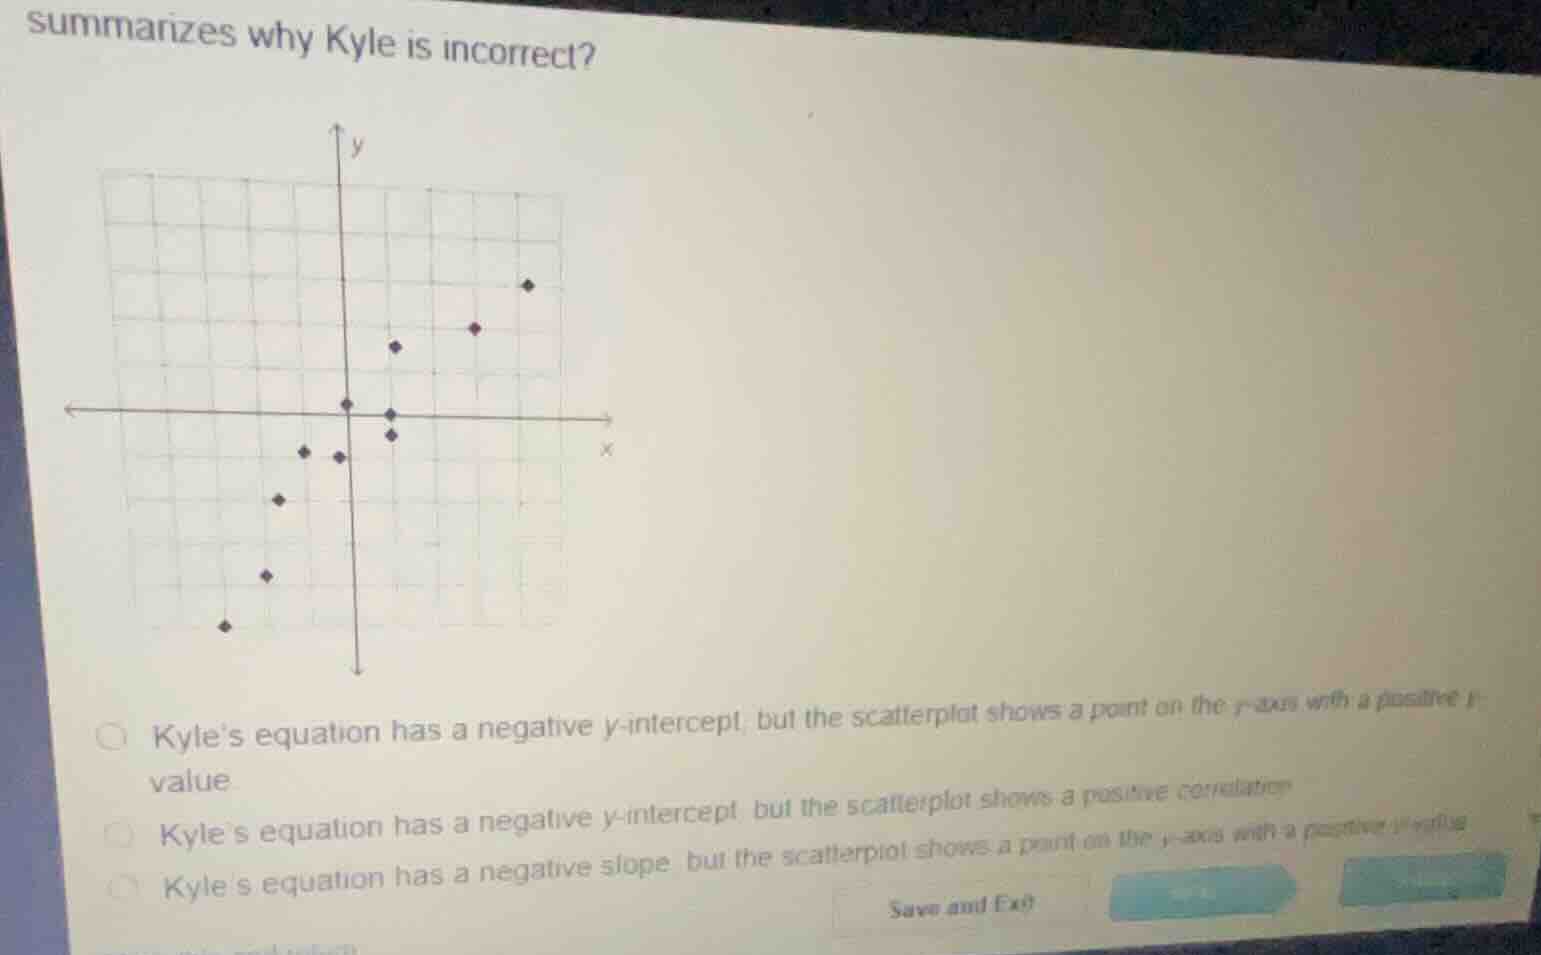
Analyze the scatter plot data points
The scatter plot contains several points:
- On the \(y\)-axis (\(x = 0\)), there is a point at \((0, 1)\), which is a positive \(y\)-value.
- The overall trend of the data points goes from the bottom-left to the top-right, indicating a positive correlation (positive slope).
Evaluate the given options
- Option 1 states: "Kyle's equation has a negative \(y\)-intercept, but the scatterplot shows a point on the \(y\)-axis with a positive \(y\)-value." This directly and correctly identifies the contradiction between a negative \(y\)-intercept in Kyle's proposed equation and the actual data point on the \(y\)-axis.
- Option 2 states: "Kyle's equation has a negative \(y\)-intercept, but the scatterplot shows a positive correlation." While the scatterplot does show a positive correlation, the presence of a negative \(y\)-intercept does not inherently contradict a positive correlation (a line can have a positive slope and a negative \(y\)-intercept).
- Option 3 states: "Kyle's equation has a negative slope, but the scatterplot shows a point on the \(y\)-axis with a positive \(y\)-value." A negative slope does not contradict having a positive \(y\)-intercept.

Snap & solve any problem in the app
Get step-by-step solutions on Sovi AI
Photo-based solutions with guided steps
Explore more problems and detailed explanations
- (A) Kyle's equation has a negative y-intercept, but the scatterplot shows a point on the y-axis with a positive y-value. (Correct answer)
- (B) Kyle's equation has a negative y-intercept, but the scatterplot shows a positive correlation.
- (C) Kyle's equation has a negative slope, but the scatterplot shows a point on the y-axis with a positive y-value.