QUESTION IMAGE
Question
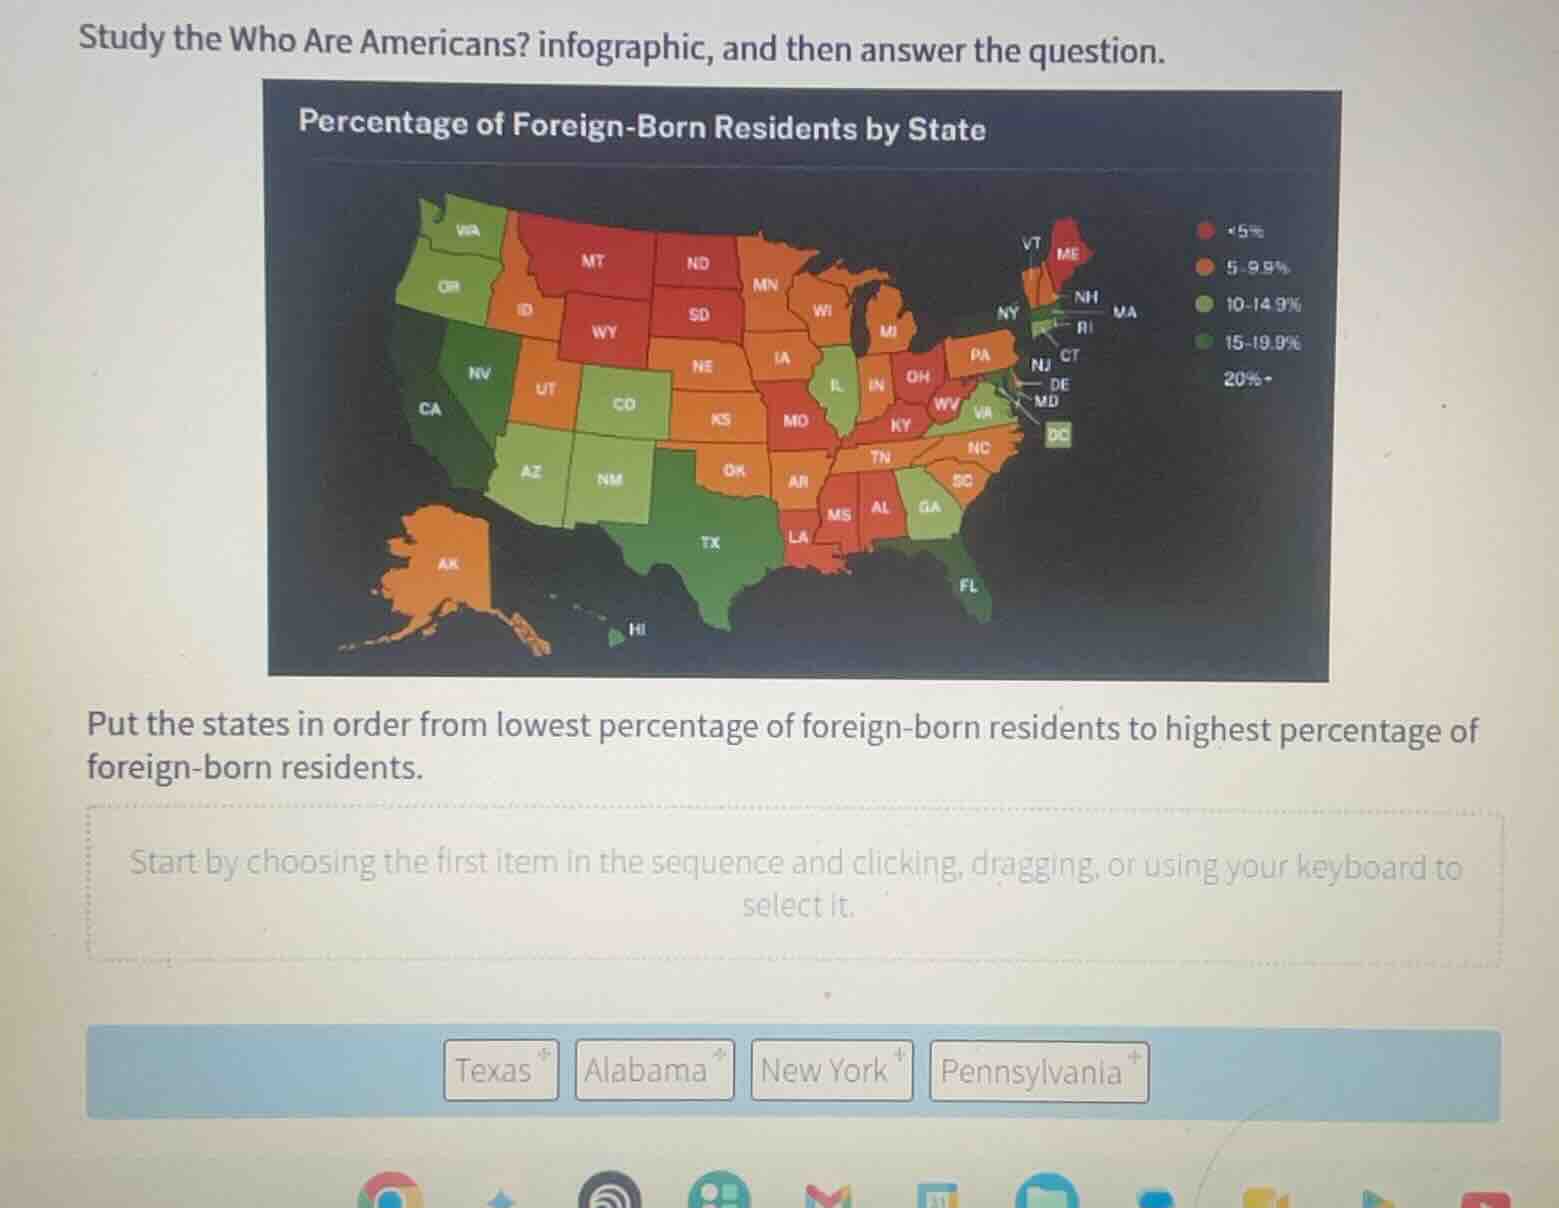
study the who are americans? infographic, and then answer the question.
put the states in order from lowest percentage of foreign-born residents to highest percentage of foreign-born residents.
texas, alabama, new york, pennsylvania
Identify the percentage category for each state
Using the map legend:
- Alabama (AL): Red color, which corresponds to the \(<5\%\) category.
- Pennsylvania (PA): Orange color, which corresponds to the \(5\text{--}9.9\%\) category.
- Texas (TX): Dark green color, which corresponds to the \(15\text{--}19.9\%\) category.
- New York (NY): Darkest green/teal color, which corresponds to the \(20\%+\) category.
Order the states from lowest to highest percentage
Sorting the states based on their percentage categories:
- Alabama (\(<5\%\))
- Pennsylvania (\(5\text{--}9.9\%\))
- Texas (\(15\text{--}19.9\%\))
- New York (\(20\%+\))

Snap & solve any problem in the app
Get step-by-step solutions on Sovi AI
Photo-based solutions with guided steps
Explore more problems and detailed explanations
- Alabama
- Pennsylvania
- Texas
- New York