QUESTION IMAGE
Question
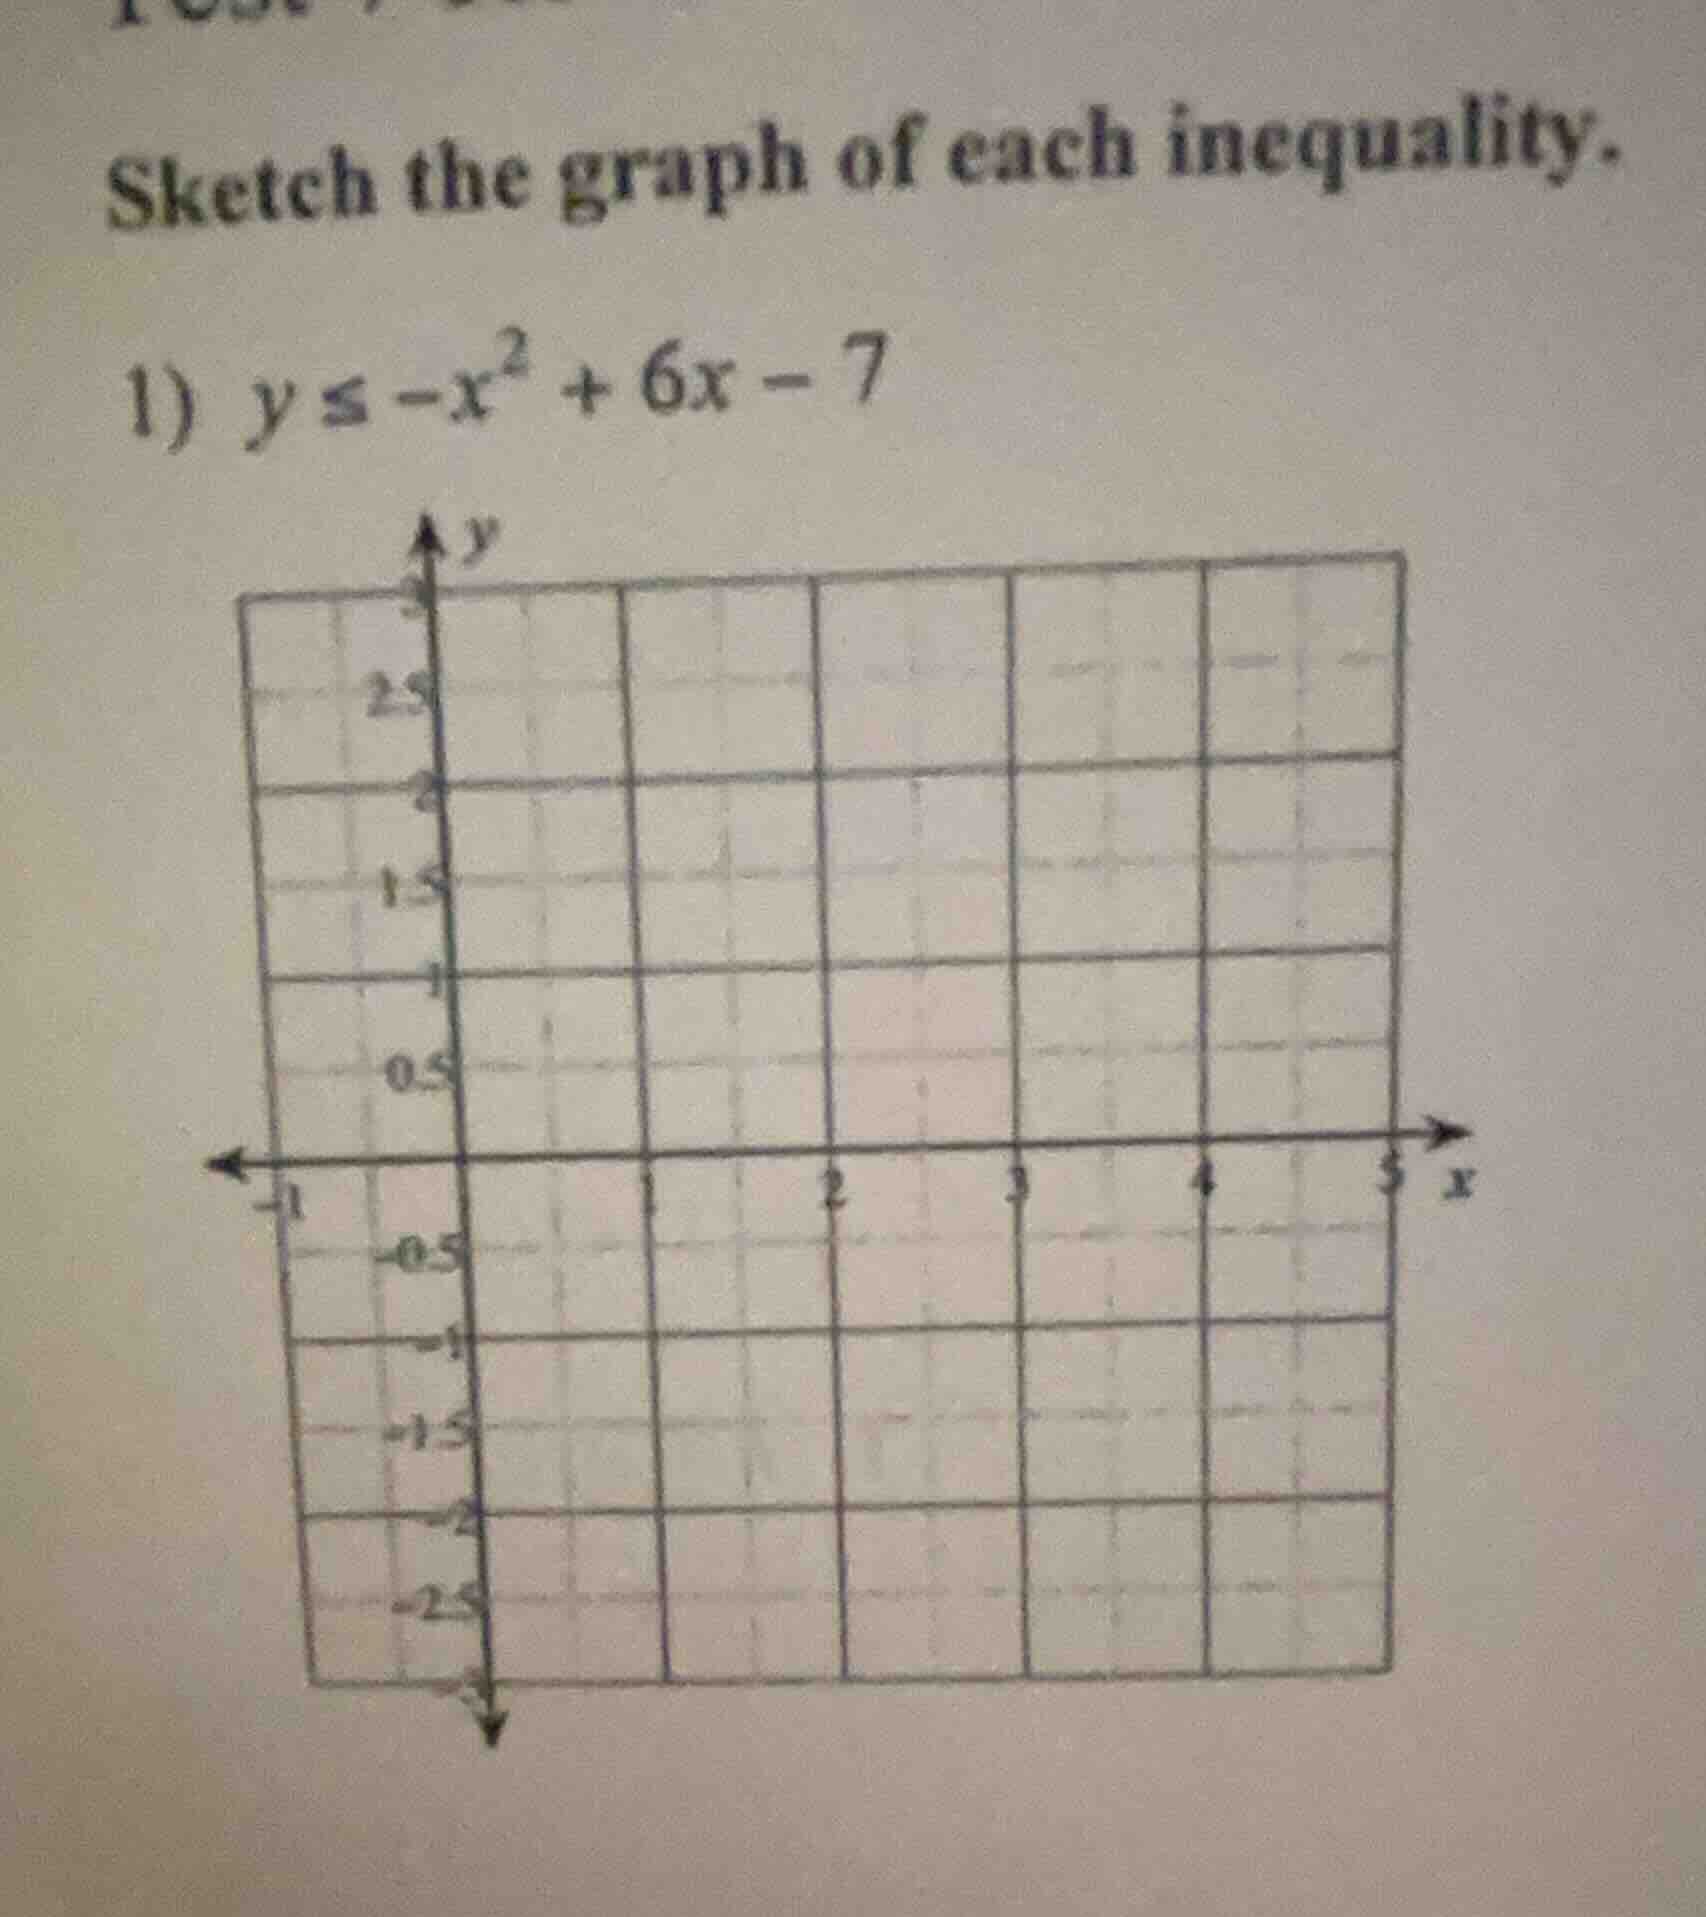
sketch the graph of each inequality.
- $y \leq -x^2 + 6x - 7$
Step1: Analyze the quadratic function
First, we rewrite the quadratic function \( y = -x^2 + 6x - 7 \) in vertex form. We complete the square:
\[
\]
So the vertex of the parabola is at \( (3, 2) \), and since the coefficient of \( x^2 \) is -1 (negative), the parabola opens downward.
Step2: Determine the boundary line
The inequality is \( y \leq -x^2 + 6x - 7 \), so the boundary line is the parabola \( y = -x^2 + 6x - 7 \), and we draw it as a solid line because the inequality includes equality (\( \leq \)).
Step3: Test a point to determine the shaded region
We can test the point \( (0, 0) \) in the inequality \( y \leq -x^2 + 6x - 7 \):
Left - hand side (LHS): \( y = 0 \)
Right - hand side (RHS): \( -0^2+6(0)-7=-7 \)
Since \( 0 \leq - 7 \) is false, we shade the region that does not include the point \( (0, 0) \), which is the region below (or inside, since the parabola opens downward) the parabola.
Graph Sketching Steps (Summary):
- Plot the vertex \( (3, 2) \).
- Find a few more points on the parabola. For example, when \( x = 1 \), \( y=-1 + 6 - 7=-2 \); when \( x = 2 \), \( y=-4 + 12 - 7 = 1 \); when \( x = 4 \), \( y=-16+24 - 7 = 1 \); when \( x = 5 \), \( y=-25 + 30 - 7=-2 \).
- Draw the parabola \( y = -x^2 + 6x - 7 \) as a solid line.
- Shade the region below the parabola (since the test point \( (0,0) \) is not in the solution set, and the parabola opens downward, the solution set is the region inside/ below the parabola).
(Note: Since this is a sketching problem, the final answer is the graph as described above. If we were to represent it in text - based description, the graph has a downward - opening parabola with vertex at (3,2), passing through points like (1, - 2), (2,1), (4,1), (5, - 2), with a solid line and the region below the parabola shaded.)

Snap & solve any problem in the app
Get step-by-step solutions on Sovi AI
Photo-based solutions with guided steps
Explore more problems and detailed explanations
The graph is a downward - opening parabola \( y =-(x - 3)^2+2 \) (drawn as a solid line) with the region below the parabola shaded.