QUESTION IMAGE
Question
select the correct answer.
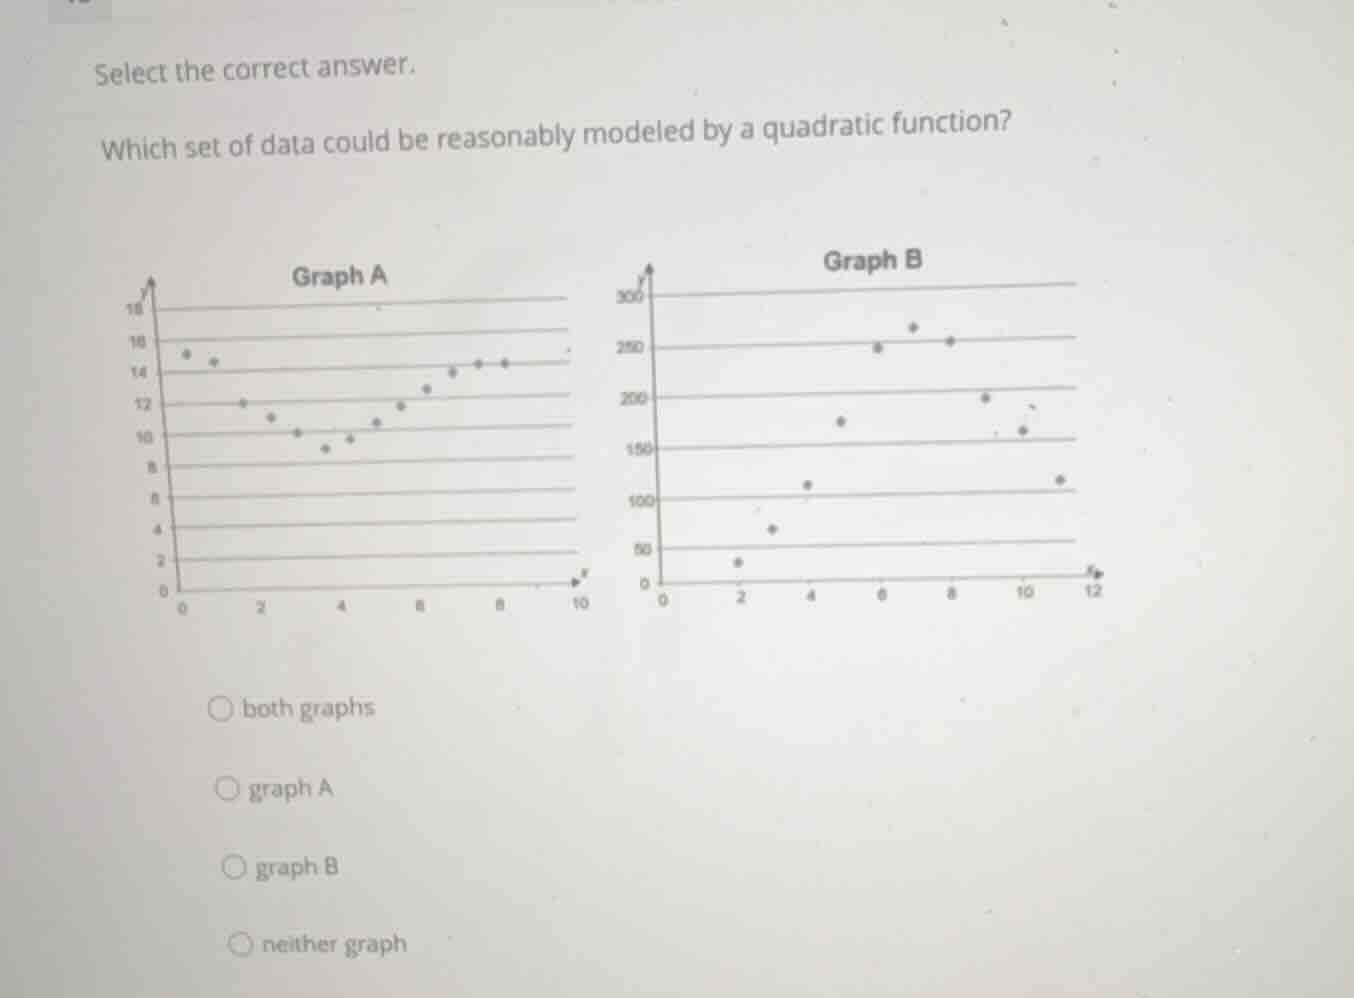
which set of data could be reasonably modeled by a quadratic function?
both graphs
graph a
graph b
neither graph
Analyze the shape of Graph A
The data points in Graph A decrease from \(x = 0\) to approximately \(x = 4\), reach a minimum point, and then increase from \(x = 4\) to \(x = 8\), forming a clear U-shaped curve (parabola opening upward).
Analyze the shape of Graph B
The data points in Graph B increase from \(x = 0\) to approximately \(x = 7\), reach a maximum point, and then decrease from \(x = 7\) to \(x = 12\), forming a clear inverted U-shaped curve (parabola opening downward).
Determine the appropriate model
Since both Graph A (upward parabola) and Graph B (downward parabola) exhibit symmetric, single-bend curved patterns characteristic of quadratic functions, both sets of data can be reasonably modeled by a quadratic function.

Snap & solve any problem in the app
Get step-by-step solutions on Sovi AI
Photo-based solutions with guided steps
Explore more problems and detailed explanations
- both graphs (Correct answer)
- graph A
- graph B
- neither graph