QUESTION IMAGE
Question
select the correct answer.
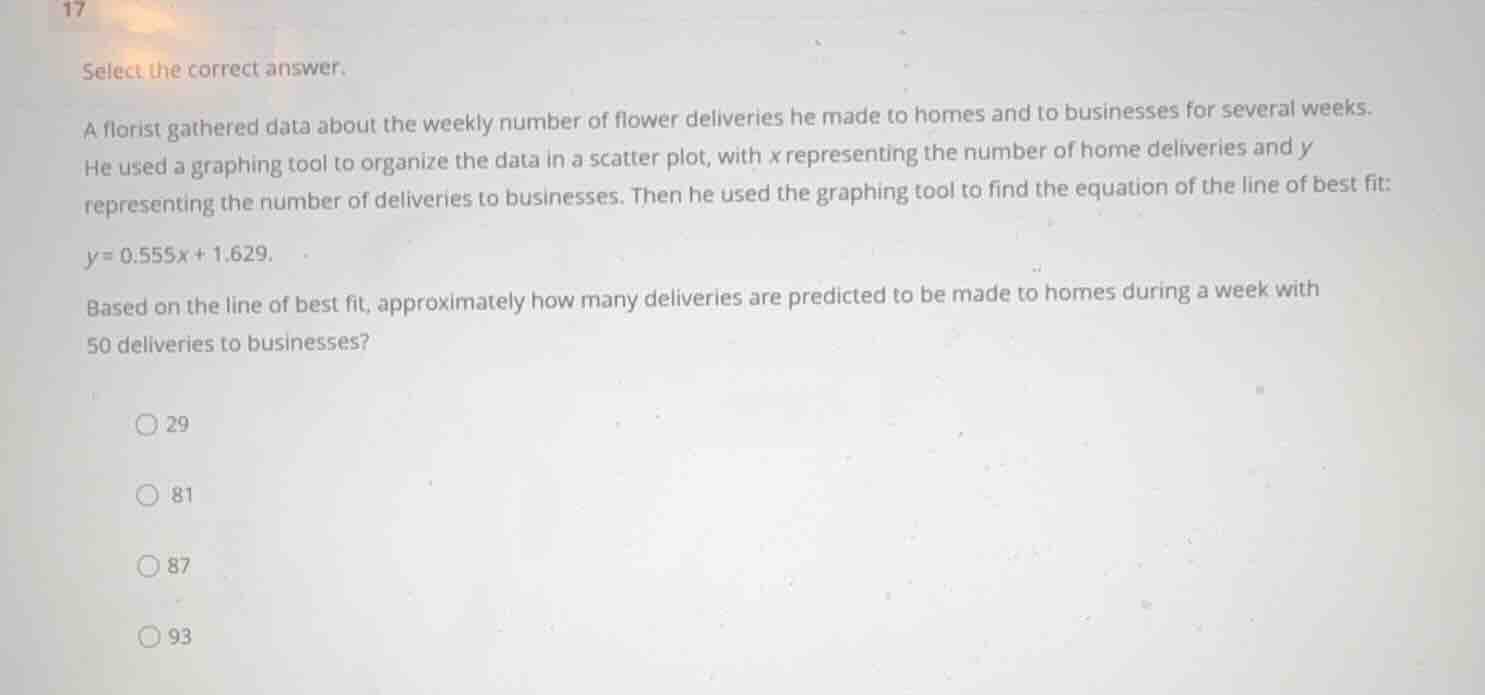
a florist gathered data about the weekly number of flower deliveries he made to homes and to businesses for several weeks. he used a graphing tool to organize the data in a scatter plot, with \\(x\\) representing the number of home deliveries and \\(y\\) representing the number of deliveries to businesses. then he used the graphing tool to find the equation of the line of best fit:
\\y = 0.555x + 1.629\\
based on the line of best fit, approximately how many deliveries are predicted to be made to homes during a week with 50 deliveries to businesses?
- 29
- 81
- 87
- 93
Identify variables and given values
$$
LATEXBLOCK0
$$
Solve for the target variable
$$
LATEXBLOCK1
$$
Match with the closest option
$$
x \approx 87
$$

Snap & solve any problem in the app
Get step-by-step solutions on Sovi AI
Photo-based solutions with guided steps
Explore more problems and detailed explanations
- (A) 29
- (B) 81
- (C) 87 (Correct answer)
- (D) 93