QUESTION IMAGE
Question
select the correct answer from each drop-down menu.
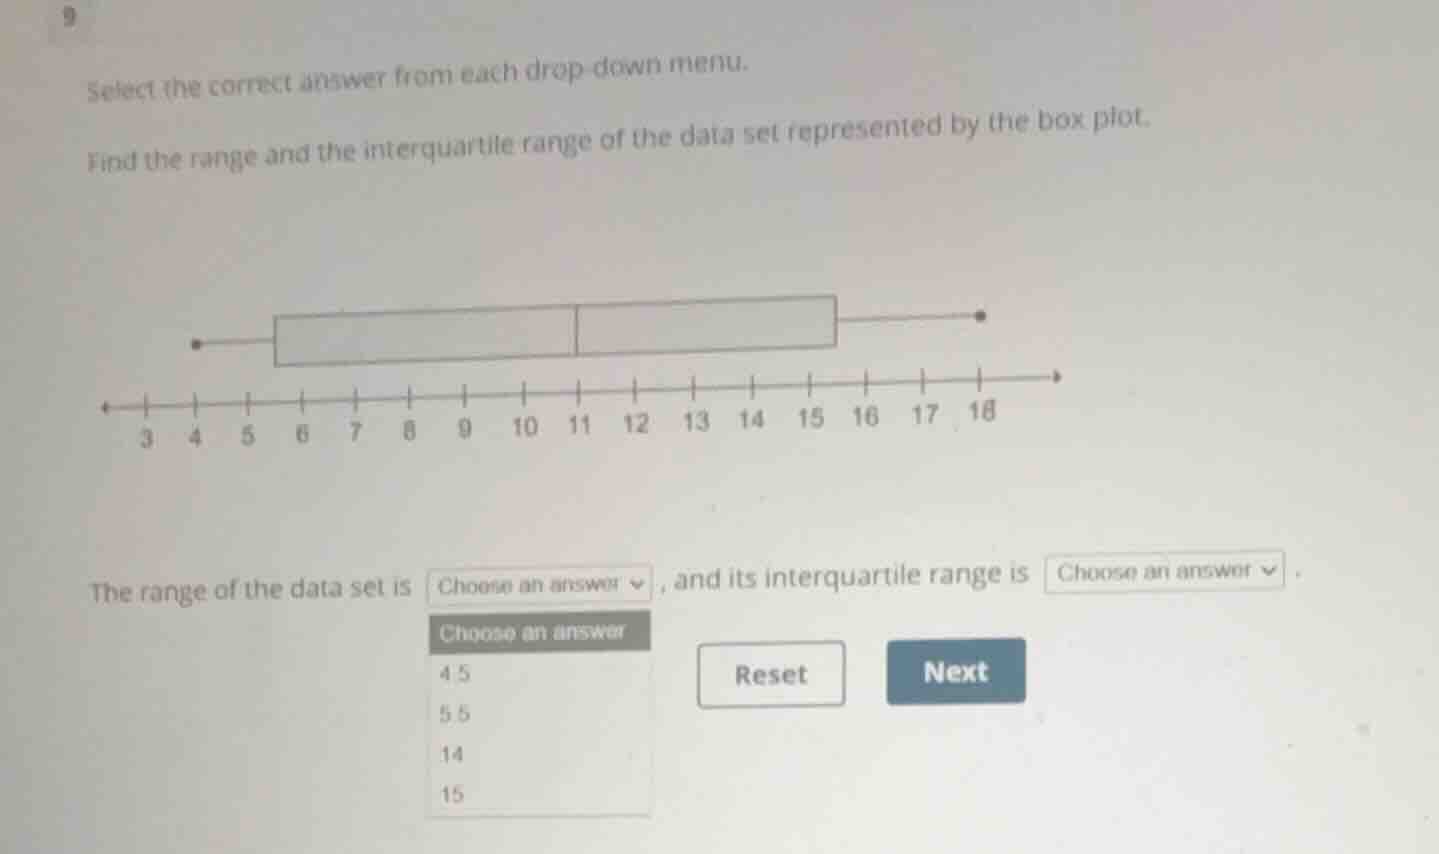
find the range and the interquartile range of the data set represented by the box plot.
the range of the data set is choose an answer, and its interquartile range is choose an answer.
Identify key values from the box plot
$$
LATEXBLOCK0
$$
Calculate the range of the data set
$$
\text{Range} = \text{Maximum} - \text{Minimum} = 18 - 4 = 14
$$
Calculate the interquartile range
$$
\text{Interquartile Range (IQR)} = Q_3 - Q_1 = 15.5 - 5.5 = 10
$$

Snap & solve any problem in the app
Get step-by-step solutions on Sovi AI
Photo-based solutions with guided steps
Explore more problems and detailed explanations
The range of the data set is <blank>14</blank>, and its interquartile range is <blank>10</blank>.