QUESTION IMAGE
Question
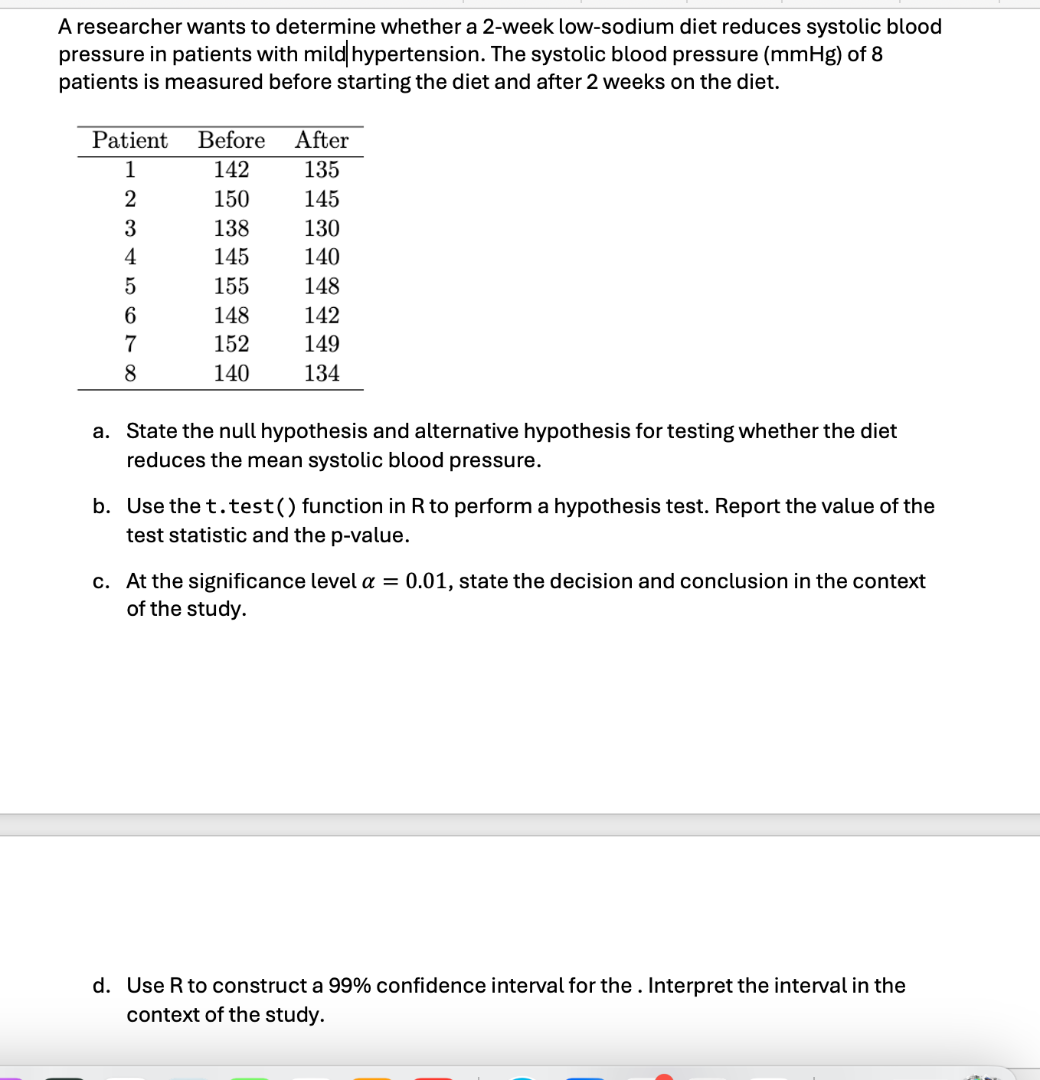
a researcher wants to determine whether a 2-week low-sodium diet reduces systolic blood pressure in patients with mild hypertension. the systolic blood pressure (mmhg) of 8 patients is measured before starting the diet and after 2 weeks on the diet.
\
a. state the null hypothesis and alternative hypothesis for testing whether the diet reduces the mean systolic blood pressure.
b. use the t.test() function in r to perform a hypothesis test. report the value of the test statistic and the p-value.
c. at the significance level \\(\alpha = 0.01\\), state the decision and conclusion in the context of the study.
d. use r to construct a 99% confidence interval for the mean difference. interpret the interval in the context of the study.
⚡ Using what you learned: Hypothesis Testing · 🆕 New: Paired t-test in R
Comparing paired measurements before and after a treatment
Step 1: State the Hypotheses
Because the measurements are taken on the same 8 patients before and after the diet, this is a paired design. Let \( d_i = \text{Before}_i - \text{After}_i \) be the difference in systolic blood pressure for patient \( i \).
Let \( \mu_d \) be the mean difference in the population (\( \mu_d = \mu_{\text{Before}} - \mu_{\text{After}} \)).
If the diet reduces systolic blood pressure, the "Before" values should be higher than the "After" values on average, meaning the mean difference \( \mu_d \) is positive (\( \mu_d > 0 \)).
- Null Hypothesis (\( H_0 \)): The diet does not reduce mean systolic blood pressure.
- Alternative Hypothesis (\( H_a \)): The diet reduces mean systolic blood pressure.
---
Step 2: Perform the Paired t-test in R
First, we calculate the differences \( d = \text{Before} - \text{After} \) for each patient:
| Patient | Before | After | Difference (\( d = \text{Before} - \text{After} \)) |
|---|---|---|---|
| 2 | 150 | 145 | \( 150 - 145 = 5 \) |
| 3 | 138 | 130 | \( 138 - 130 = 8 \) |
| 4 | 145 | 140 | \( 145 - 140 = 5 \) |
| 5 | 155 | 148 | \( 155 - 148 = 7 \) |
| 6 | 148 | 142 | \( 148 - 142 = 6 \) |
| 7 | 152 | 149 | \( 152 - 149 = 3 \) |
| 8 | 140 | 134 | \( 140 - 134 = 6 \) |
Summary Statistics of Differences:
- Sample size: \( n = 8 \)
- Mean difference:
- Sample standard deviation of differences (\( s_d \)):
R Code:
before <- c(142, 150, 138, 145, 155, 148, 152, 140)
after <- c(135, 145, 130, 140, 148, 142, 149, 134)

# Perform paired t-test (one-sided, alternative is 'greater' since we test if Before > After)
t.test(before, after, paired = TRUE, alternative = "greater")
Test Statistic and p-value Calculation:
- Standard Error (\( SE \)):
- t-statistic:
- Degrees of Freedom:
- p-value:
Using a \( t \)-distribution with 7 degrees of freedom for a one-tailed test:
---
Step 3: Decision and Conclusion (\( \alpha = 0.01 \))
- Decision: Since the \( p\text{-value} \approx 0.0000064 \) is much smaller than the significance level \( \alpha = 0.01 \), we reject the null hypothesis (\( H_0 \)).
- Conclusion: There is extremely strong evidence to conclude that the 2-week low-sodium diet significantly reduces the mean systolic blood pressure in patients with mild hypertension.
---
Step 4: Construct and Interpret the 99% Confidence Interval
To find the two-sided 99% confidence interval for the mean difference \( \mu_d \):
R Code:
# Two-sided 99% confidence interval for the paired difference
t.test(before, after, paired = TRUE, conf.level = 0.99)
Calculation:
- Critical value \( t^* \) for \( df = 7 \) at a 99% confidence level (two-tailed):
- Margin of Error (\( ME \)):
- Confidence Interval:
\[ \bar{d} \pm ME = 5.875 \pm 1.921…

Snap & solve any problem in the app
Get step-by-step solutions on Sovi AI
Photo-based solutions with guided steps
Explore more problems and detailed explanations
a. Hypotheses
- \( H_0: \mu_d = 0 \)
- \( H_a: \mu_d > 0 \)
(where \( \mu_d = \mu_{\text{Before}} - \mu_{\text{After}} \))
b. R Test Results
- Test Statistic (\( t \)): \( 10.703 \)
- p-value: \( 6.4 \times 10^{-6} \) (or \( 0.0000064 \))
c. Decision and Conclusion (\( \alpha = 0.01 \))
- Decision: Reject \( H_0 \) because \( p\text{-value} < 0.01 \).
- Conclusion: There is statistically significant evidence that the 2-week low-sodium diet reduces mean systolic blood pressure in patients with mild hypertension.
d. 99% Confidence Interval
- 99% CI: \( (3.95, 7.80) \text{ mmHg} \)
- Interpretation: We are 99% confident that the true mean reduction in systolic blood pressure due to the diet is between \( 3.95 \text{ mmHg} \) and \( 7.80 \text{ mmHg} \).