QUESTION IMAGE
Question
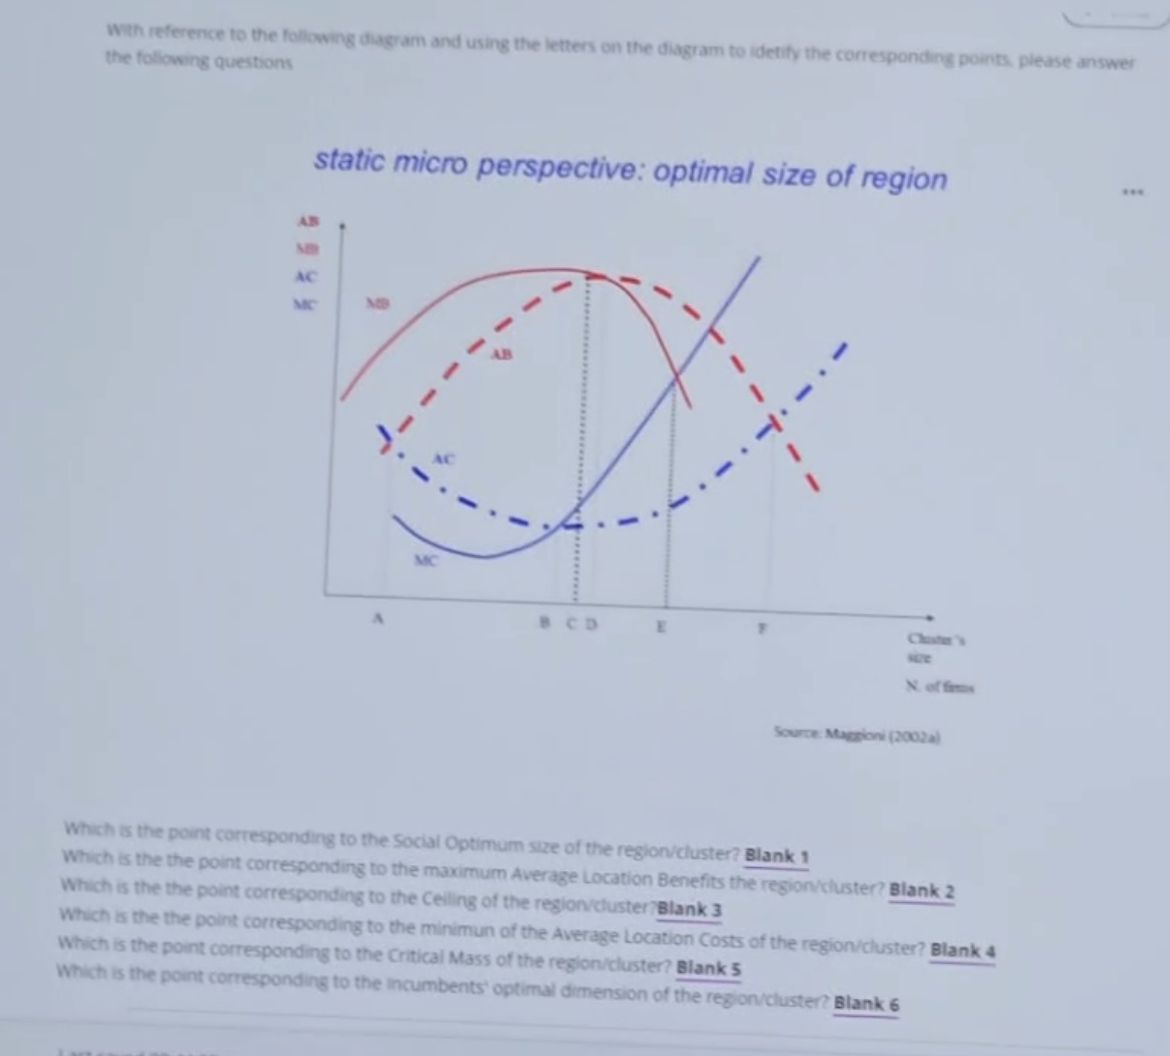
with reference to the following diagram and using the letters on the diagram to identify the corresponding points, please answer the following questions
static micro perspective: optimal size of region
which is the point corresponding to the social optimum size of the region/cluster? blank 1
which is the point corresponding to the maximum average location benefits the region/cluster? blank 2
which is the point corresponding to the ceiling of the region/cluster? blank 3
which is the point corresponding to the minimum of the average location costs of the region/cluster? blank 4
which is the point corresponding to the critical mass of the region/cluster? blank 5
which is the point corresponding to the incumbents optimal dimension of the region/cluster? blank 6
🆕 New Concept Discovered: Optimal Cluster Size Model
Analyzing regional benefits and costs to find equilibrium points
Step 1: Identify the Curves and Variables
In this regional economics model (based on Maggioni, 2002), we analyze the optimal size of a cluster or region (measured by the number of firms on the horizontal axis) using benefits and costs:
- AB (Average Benefit): The dashed red curve representing the average benefit per firm.
- MB (Marginal Benefit): The solid red curve representing the additional benefit of adding one more firm.
- AC (Average Cost): The dashed blue curve representing the average cost per firm.
- MC (Marginal Cost): The solid blue curve representing the additional cost of adding one more firm.
---
Step 2: Find the Social Optimum (Blank 1)
The Social Optimum size of the cluster maximizes the net social benefit (Total Benefit minus Total Cost). This occurs where the marginal benefit equals the marginal cost:
Looking at the diagram, the solid red curve (\(\text{MB}\)) and the solid blue curve (\(\text{MC}\)) intersect at the vertical dotted line corresponding to point D.
---
Step 3: Find the Maximum Average Location Benefits (Blank 2)
The Average Location Benefit is represented by the dashed red curve (\(\text{AB}\)). The peak (maximum point) of this curve occurs where the marginal benefit curve (\(\text{MB}\)) intersects it from above:
This peak corresponds to the vertical dotted line at point D.
---
Step 4: Find the Ceiling of the Region/Cluster (Blank 3)
The Ceiling (or maximum sustainable size) of the cluster is the point beyond which average costs exceed average benefits, making it unprofitable for the average firm to remain. This zero-profit/break-even boundary occurs where:
This intersection of the two dashed curves (\(\text{AB}\) and \(\text{AC}\)) occurs at point F.
---
Step 5: Find the Minimum of the Average Location Costs (Blank 4)
The Average Location Cost is represented by the dashed blue curve (\(\text{AC}\)). The minimum point of this U-shaped curve occurs where the marginal cost curve (\(\text{MC}\)) intersects it from below:
Looking at the diagram, the minimum of the dashed blue curve (\(\text{AC}\)) corresponds to point C.
---
Step 6: Find the Critical Mass of the Region/Cluster (Blank 5)
The Critical Mass is the minimum size the cluster must reach to become self-sustaining. Below this size, average costs exceed average benefits. It is the first intersection point where average benefits begin to exceed average costs:
This entry threshold corresponds to point A.
---
Step 7: Find the Incumbents' Optimal Dimension (Blank 6)
The Incumbents' Optimal Dimension is the cluster size that maximizes the net benefit for the existing (incumbent) firms already in the cluster. Existing firms want to maximize the gap between average benefit and average cost:
This maximum vertical distance between the dashed curves \(\text{AB}\) and \(\text{AC}\) occurs where their slopes are equal, which is where marginal benefit equals marginal cost for the average values, corresponding to point B.
---

Snap & solve any problem in the app
Get step-by-step solutions on Sovi AI
Photo-based solutions with guided steps
Explore more problems and detailed explanations
- Blank 1 (Social Optimum): D
- Blank 2 (Maximum Average Location Benefits): D
- Blank 3 (Ceiling): F
- Blank 4 (Minimum Average Location Costs): C
- Blank 5 (Critical Mass): A
- Blank 6 (Incumbents' Optimal Dimension): B