QUESTION IMAGE
Question
question 31 points 2
which of the following is true about the distribution shown below?
parasailing costs ($)
bi-modal
skewed left
Analyze the dot plot shape
Using the Symmetric Distribution knowledge point
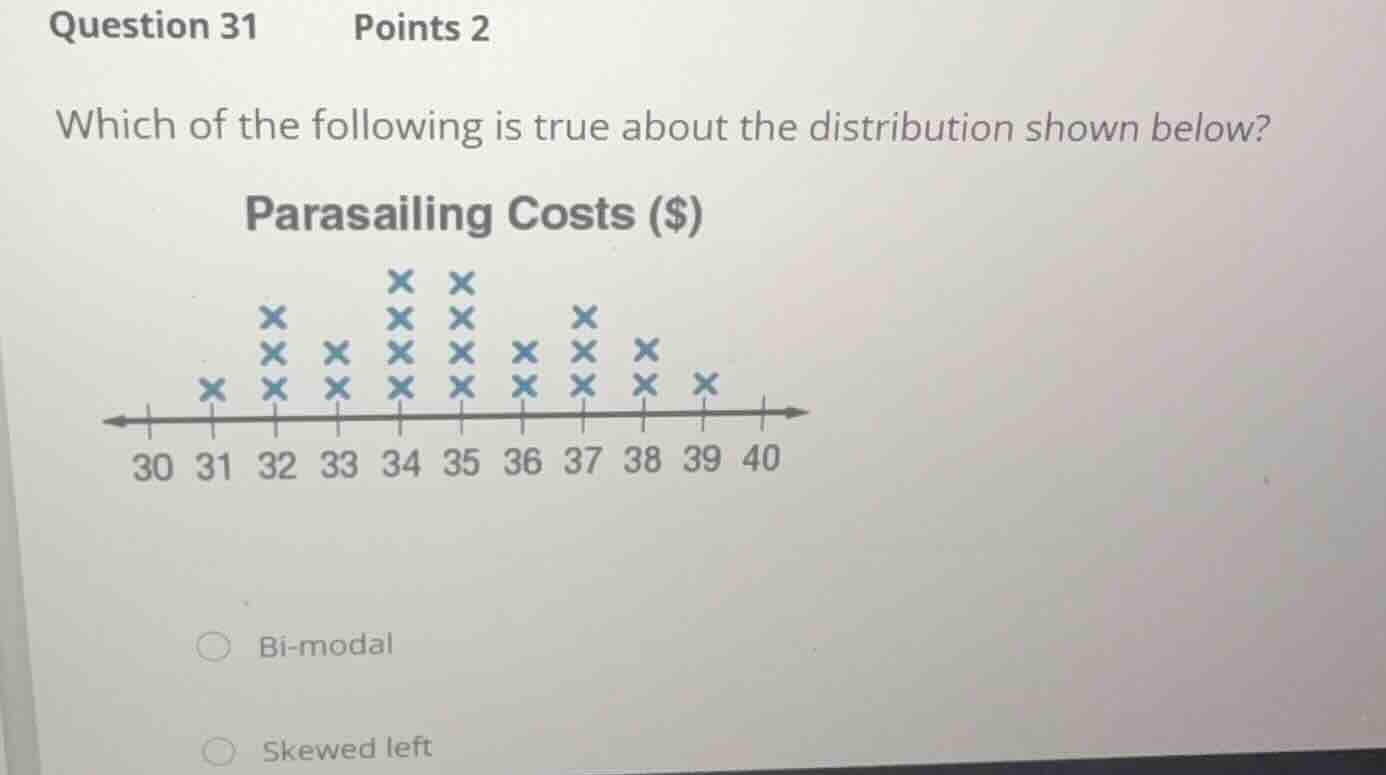
The dot plot shows the frequency of parasailing costs. Let's count the data points (represented by 'x') for each value:
- 31: 1
- 32: 3
- 33: 2
- 34: 4
- 35: 4
- 36: 2
- 37: 3
- 38: 2
- 39: 1
The distribution is centered around 34 and 35, with frequencies tapering off almost symmetrically on both sides (1, 3, 2, 4 on the left; 4, 2, 3, 2, 1 on the right).
Evaluate the options
Using the Symmetric Distribution and Skewness Direction knowledge points
- Bi-modal: A bimodal distribution has two distinct, prominent peaks separated by a valley. Here, the highest frequency is 4 (at both 34 and 35), which form a single central peak area rather than two separated peaks. Thus, it is unimodal.
- Skewed left: A left-skewed distribution has a long tail extending to the left (lower values). Here, the left tail (down to 31) and the right tail (up to 39) are balanced and of equal length. Therefore, the distribution is symmetric, not skewed left.
Since the visible options are "Bi-modal" and "Skewed left", and neither is true, let's identify the correct description. A symmetric, unimodal distribution is best described as Symmetric (or approximately normal/bell-shaped).

Snap & solve any problem in the app
Get step-by-step solutions on Sovi AI
Photo-based solutions with guided steps
Explore more problems and detailed explanations
- Bi-modal
- Skewed left
- Symmetric (Correct answer)