QUESTION IMAGE
Question
question 3 of 10
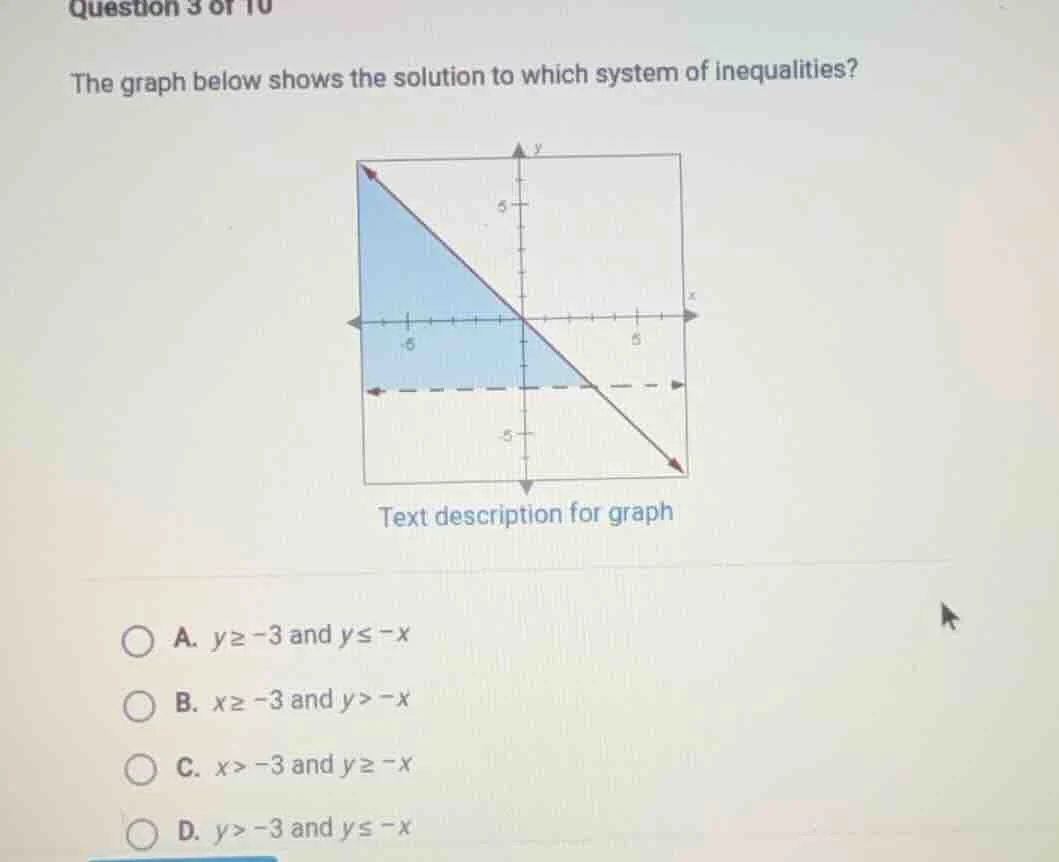
the graph below shows the solution to which system of inequalities?
graph
text description for graph
a. $y \geq -3$ and $y \leq -x$
b. $x \geq -3$ and $y > -x$
c. $x > -3$ and $y \geq -x$
d. $y > -3$ and $y \leq -x$
Brief Explanations
- Analyze the horizontal boundary: The dashed line is \( y = - 3 \), and the shaded region is above this line (since the line is dashed, the inequality is \( y>-3 \)).
- Analyze the slant boundary: The line \( y=-x \) (passes through the origin, slope - 1). The shaded region is below or on this line, so the inequality is \( y\leq - x \).
- Check options: Option D has \( y > - 3 \) (matches the horizontal boundary) and \( y\leq -x \) (matches the slant boundary).

Snap & solve any problem in the app
Get step-by-step solutions on Sovi AI
Photo-based solutions with guided steps
Explore more problems and detailed explanations
D. \( y > -3 \) and \( y \leq -x \)