QUESTION IMAGE
Question
post test: functions
drag each graph to the correct location on the table.
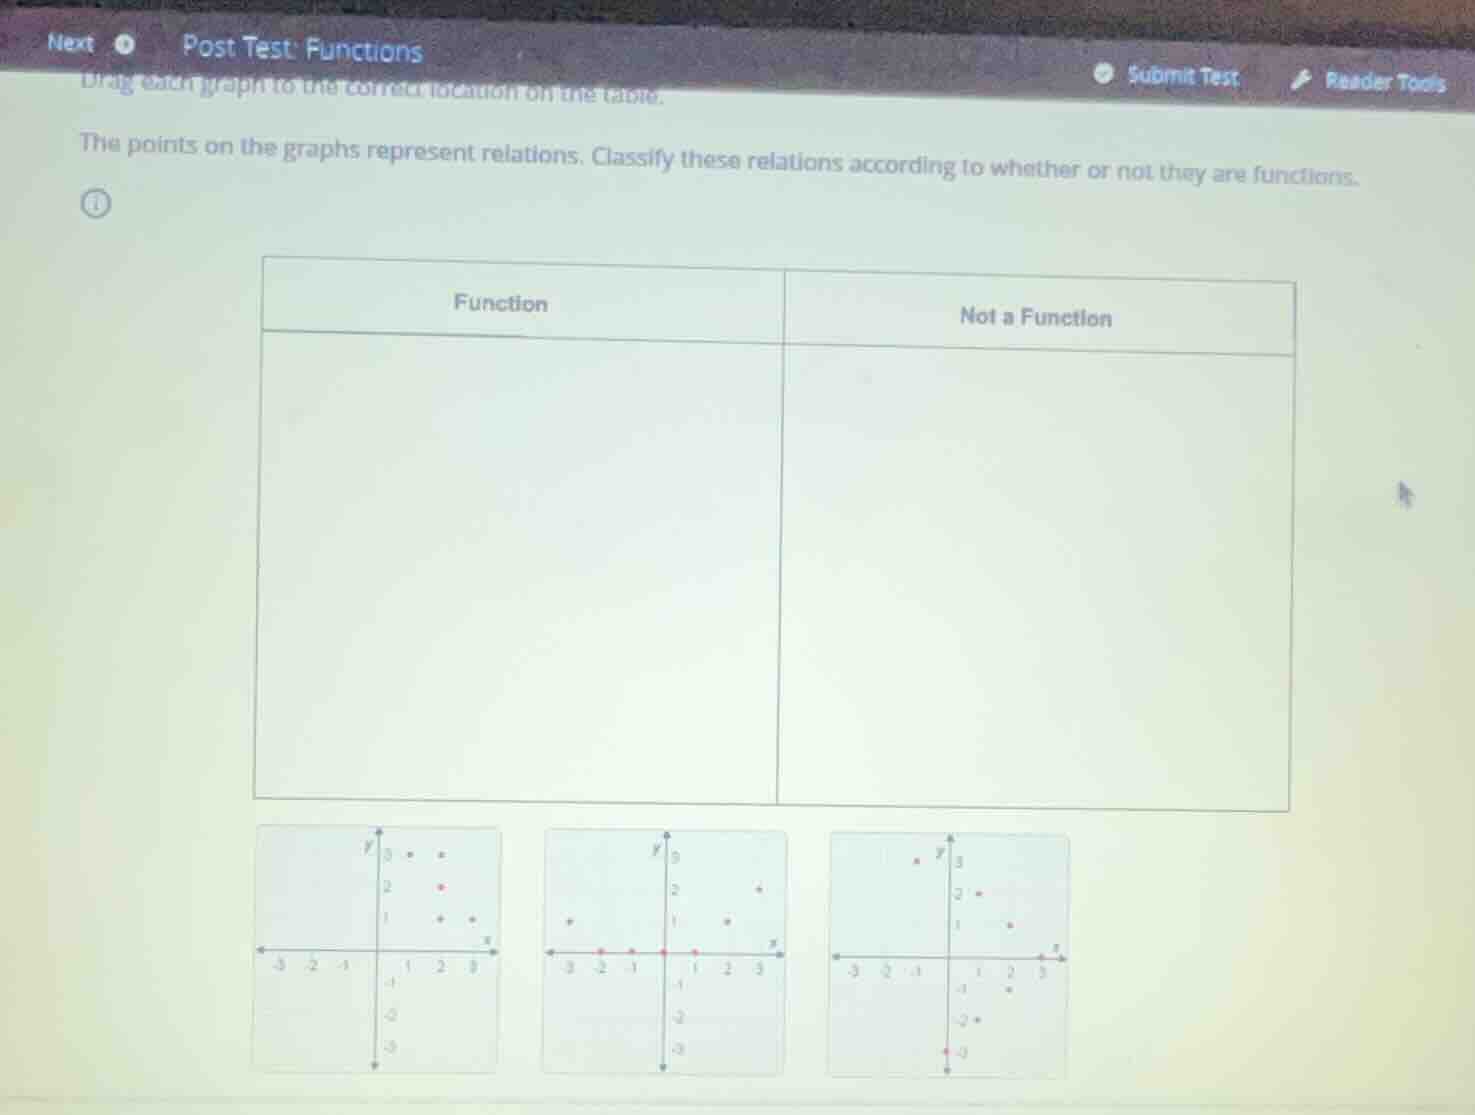
the points on the graphs represent relations. classify these relations according to whether or not they are functions.
function | not a function
Define the mathematical rule for a function
A relation is a function if and only if each input \(x\) is paired with exactly one output \(y\). On a graph of discrete points, this means no two points can share the same \(x\)-coordinate. Visually, we apply the Vertical Line Test: if any vertical line passes through more than one point, the relation is not a function.
Analyze the first graph (left)
Let's identify the coordinates of the plotted points on the first graph:
- There is a point at \((1, 3)\).
- There is a point at \((2, 3)\).
- There is a point at \((2, 2)\).
- There is a point at \((2.5, 1)\).
- There is a point at \((3, 0)\).
Notice that we have two points sharing the same \(x\)-coordinate: \((2, 3)\) and \((2, 2)\). A vertical line at \(x = 2\) passes through both points. Therefore, this relation is Not a Function.
Analyze the second graph (middle)
Let's identify the coordinates of the plotted points on the second graph:
- There is a point at \((-2, 0)\).
- There is a point at \((-1, 0)\).
- There is a point at \((1, -1)\).
- There is a point at \((2, 1)\).
- There is a point at \((3, 2)\).
- There is a point at \((3.5, 0)\).
Each plotted point has a unique \(x\)-coordinate. No vertical line passes through more than one point. Therefore, this relation is a Function.
Analyze the third graph (right)
Let's identify the coordinates of the plotted points on the third graph:
- There is a point at \((-1, 3)\).
- There is a point at \((1, 2)\).
- There is a point at \((1.5, -2)\).
- There is a point at \((2, 1)\).
- There is a point at \((2.5, -1)\).
- There is a point at \((3, 0)\).
Each plotted point has a unique \(x\)-coordinate. No vertical line passes through more than one point. Therefore, this relation is a Function.
Summarize the classification
- Function: Second graph (middle), Third graph (right)
- Not a Function: First graph (left)

Snap & solve any problem in the app
Get step-by-step solutions on Sovi AI
Photo-based solutions with guided steps
Explore more problems and detailed explanations
Based on the vertical line test, the relations are classified as follows:
- Function:
- Middle Graph (points: \((-2, 0)\), \((-1, 0)\), \((1, -1)\), \((2, 1)\), \((3, 2)\), \((3.5, 0)\))
- Right Graph (points: \((-1, 3)\), \((1, 2)\), \((1.5, -2)\), \((2, 1)\), \((2.5, -1)\), \((3, 0)\))
- Not a Function:
- Left Graph (contains points \((2, 3)\) and \((2, 2)\) which share the same \(x\)-value)