QUESTION IMAGE
Question
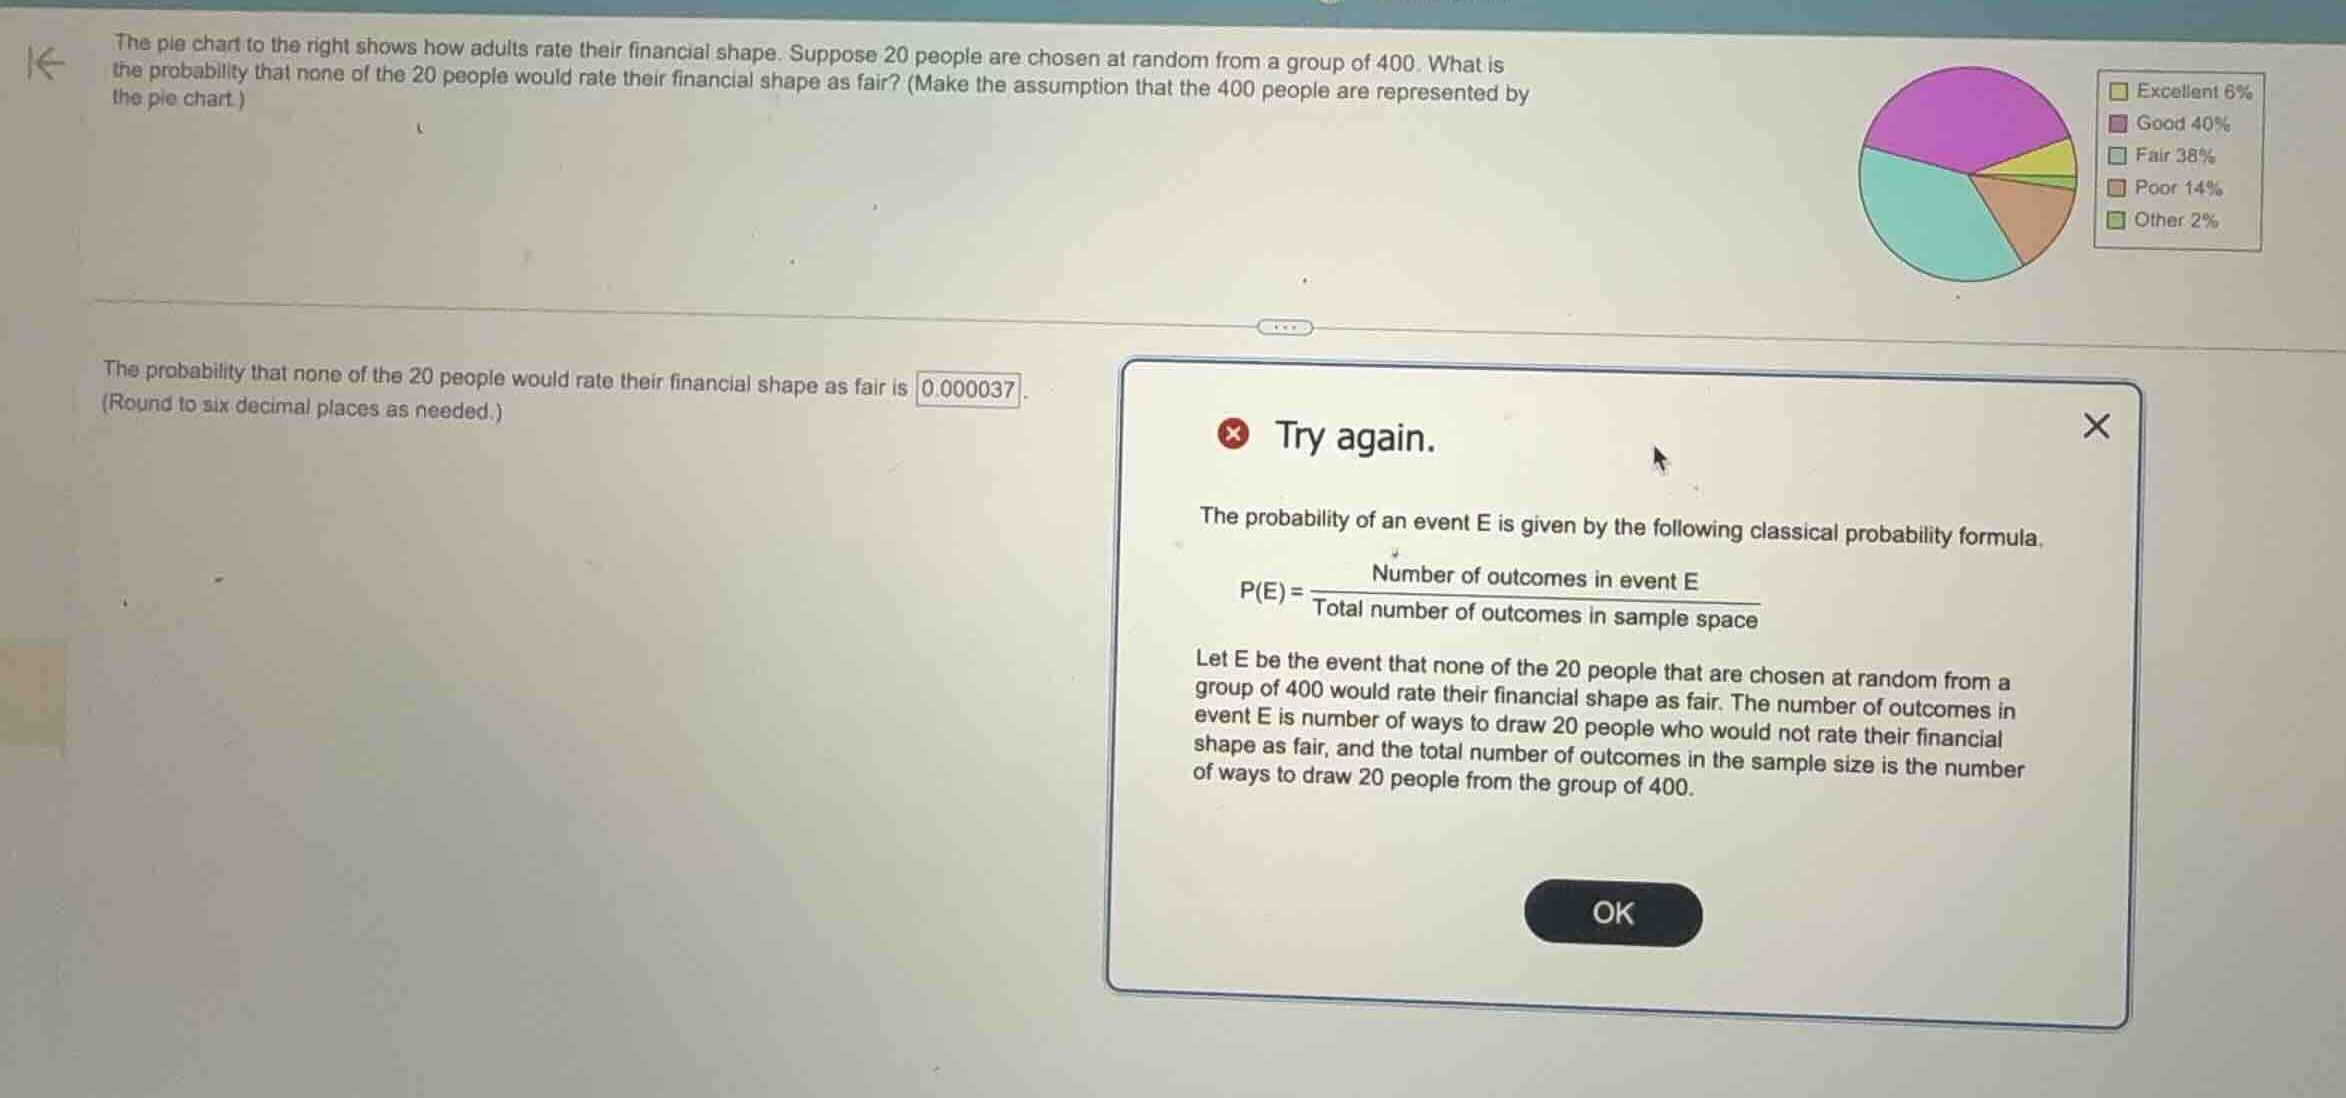
the pie chart to the right shows how adults rate their financial shape. suppose 20 people are chosen at random from a group of 400. what is the probability that none of the 20 people would rate their financial shape as fair? (make the assumption that the 400 people are represented by the pie chart.)
excellent 6%
good 40%
fair 38%
poor 14%
other 2%
the probability that none of the 20 people would rate their financial shape as fair is .
(round to six decimal places as needed.)
Identify population parameters
Using the Sampling Without Replacement and Hypergeometric Distribution knowledge points
Set up hypergeometric probability
Using the Combinatorics and Hypergeometric Distribution knowledge points
Calculate the probability value
Using the Hypergeometric Distribution knowledge point
Round to six decimal places
Using the Hypergeometric Distribution knowledge point

Snap & solve any problem in the app
Get step-by-step solutions on Sovi AI
Photo-based solutions with guided steps
Explore more problems and detailed explanations
The probability that none of the 20 people would rate their financial shape as fair is <blank>0.000032</blank>.