QUESTION IMAGE
Question
part c: free response questions.
you must show some work to get full credit.
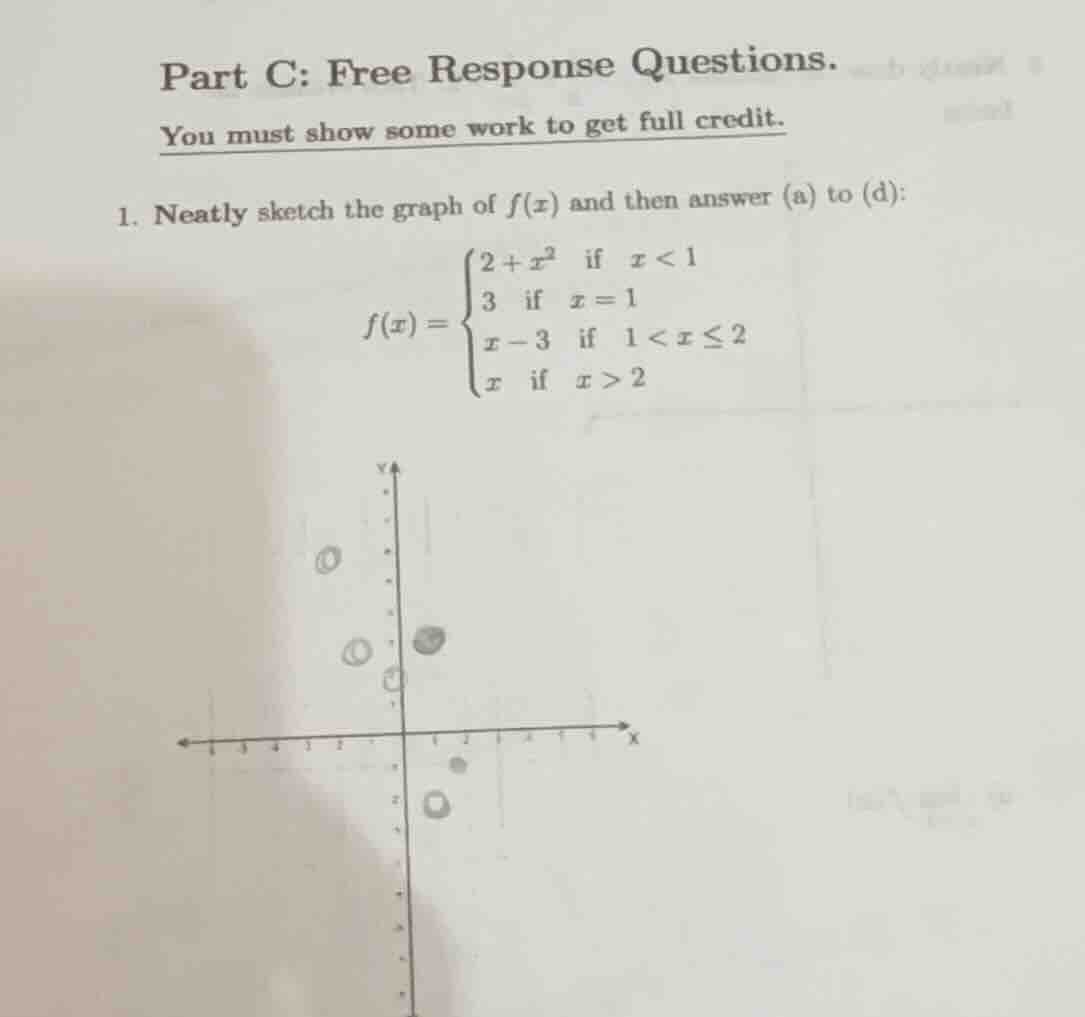
- neatly sketch the graph of \\(f(x)\\) and then answer (a) to (d):
\\f(x) = \
$$\begin{cases} 2+x^2 & \\text{if } x < 1 \\\\ 3 & \\text{if } x = 1 \\\\ x-3 & \\text{if } 1 < x \\le 2 \\\\ x & \\text{if } x > 2 \\end{cases}$$
\\
Analyze the piecewise function components
We analyze each piece of the function \(f(x)\):
- For \(x < 1\), \(f(x) = 2 + x^2\). This is a parabola opening upwards with vertex at \((0, 2)\). As \(x \to 1^-\), \(f(x) \to 3\). Since the inequality is strict (\(x < 1\)), there is an open circle at \((1, 3)\).
- For \(x = 1\), \(f(x) = 3\). This is a single point at \((1, 3)\). Since the limit from the left is also \(3\), the point fills the open circle, making the function continuous from the left at \(x = 1\).
- For \(1 < x \le 2\), \(f(x) = x - 3\). This is a linear segment. At the left boundary \(x \to 1^+\), \(f(x) \to -2\) (open circle at \((1, -2)\)). At the right boundary \(x = 2\), \(f(2) = -1\) (closed circle at \((2, -1)\)).
- For \(x > 2\), \(f(x) = x\). This is a linear ray. As \(x \to 2^+\), \(f(x) \to 2\) (open circle at \((2, 2)\)).
Identify key plotting coordinates
We determine key points to plot each section accurately:
- Parabolic piece \(y = x^2 + 2\) for \(x < 1\):
- At \(x = -2\), \(y = 6\)
- At \(x = -1\), \(y = 3\)
- At \(x = 0\), \(y = 2\) (y-intercept)
- At \(x \to 1^-\), \(y \to 3\)
- Point piece:
- At \(x = 1\), \(y = 3\)
- First linear piece \(y = x - 3\) for \(1 < x \le 2\):
- At \(x \to 1^+\), \(y \to -2\) (open circle)
- At \(x = 2\), \(y = -1\) (closed circle)
- Second linear piece \(y = x\) for \(x > 2\):
- At \(x \to 2^+\), \(y \to 2\) (open circle)
- At \(x = 3\), \(y = 3\)
- At \(x = 4\), \(y = 4\)
Determine continuity and boundary behavior
We examine the behavior at the boundary points \(x = 1\) and \(x = 2\):
- At \(x = 1\):
- \(\lim_{x \to 1^-} f(x) = 3\)
- \(f(1) = 3\)
- \(\lim_{x \to 1^+} f(x) = -2\)
- Since the left-hand limit equals the function value but the right-hand limit does not, there is a jump discontinuity at \(x = 1\).
- At \(x = 2\):
- \(\lim_{x \to 2^-} f(x) = -1\)
- \(f(2) = -1\)
- \(\lim_{x \to 2^+} f(x) = 2\)
- There is another jump discontinuity at \(x = 2\).

Snap & solve any problem in the app
Get step-by-step solutions on Sovi AI
Photo-based solutions with guided steps
Explore more problems and detailed explanations
To sketch the graph of the piecewise-defined function:
$$
f(x) =
LATEXBLOCK0
$$
Follow these specifications for each interval:
- For \(x < 1\): Plot the parabolic curve \(y = x^2 + 2\).
- Key points: \((-2, 6)\), \((-1, 3)\), and \((0, 2)\).
- As \(x\) approaches \(1\) from the left, the curve approaches \((1, 3)\).
- For \(x = 1\): Plot a solid point at \((1, 3)\). This solid point perfectly fills the open endpoint of the parabola, making the graph continuous from the left at \(x = 1\).
- For \(1 < x \le 2\): Plot the line segment \(y = x - 3\).
- Place an open circle at \((1, -2)\) since \(x > 1\).
- Place a solid circle at \((2, -1)\) since \(x \le 2\).
- For \(x > 2\): Plot the ray \(y = x\).
- Place an open circle at \((2, 2)\) since \(x > 2\).
- Draw the line extending upwards and to the right through points like \((3, 3)\) and \((4, 4)\).