QUESTION IMAGE
Question
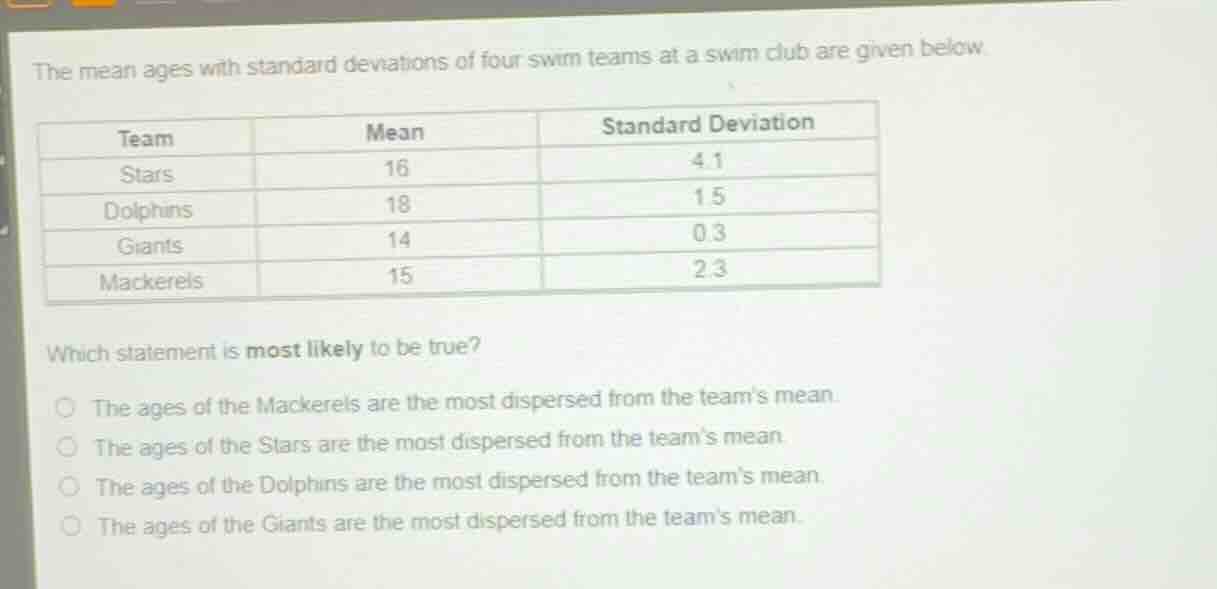
the mean ages with standard deviations of four swim teams at a swim club are given below.
\
which statement is most likely to be true?
- the ages of the mackerels are the most dispersed from the teams mean.
- the ages of the stars are the most dispersed from the teams mean.
- the ages of the dolphins are the most dispersed from the teams mean.
- the ages of the giants are the most dispersed from the teams mean.
Identify the statistical measure of dispersion
Using the Measures of Spread knowledge point
Standard deviation measures the spread or dispersion of data points around their mean. A higher standard deviation indicates that the data points are more spread out (more dispersed) from the mean, while a lower standard deviation indicates they are clustered closer to the mean.
Compare the standard deviations of the teams
We compare the standard deviation values given in the table for each team:
- Stars: \(4.1\)
- Dolphins: \(1.5\)
- Giants: \(0.3\)
- Mackerels: \(2.3\)
Determine the most dispersed team
The team with the highest standard deviation is the Stars with a value of \(4.1\). Therefore, the ages of the Stars are the most dispersed from their team's mean. This matches the second statement.

Snap & solve any problem in the app
Get step-by-step solutions on Sovi AI
Photo-based solutions with guided steps
Explore more problems and detailed explanations
- The ages of the Mackerels are the most dispersed from the team's mean.
- The ages of the Stars are the most dispersed from the team's mean. (Correct answer)
- The ages of the Dolphins are the most dispersed from the team's mean.
- The ages of the Giants are the most dispersed from the team's mean.