QUESTION IMAGE
Question
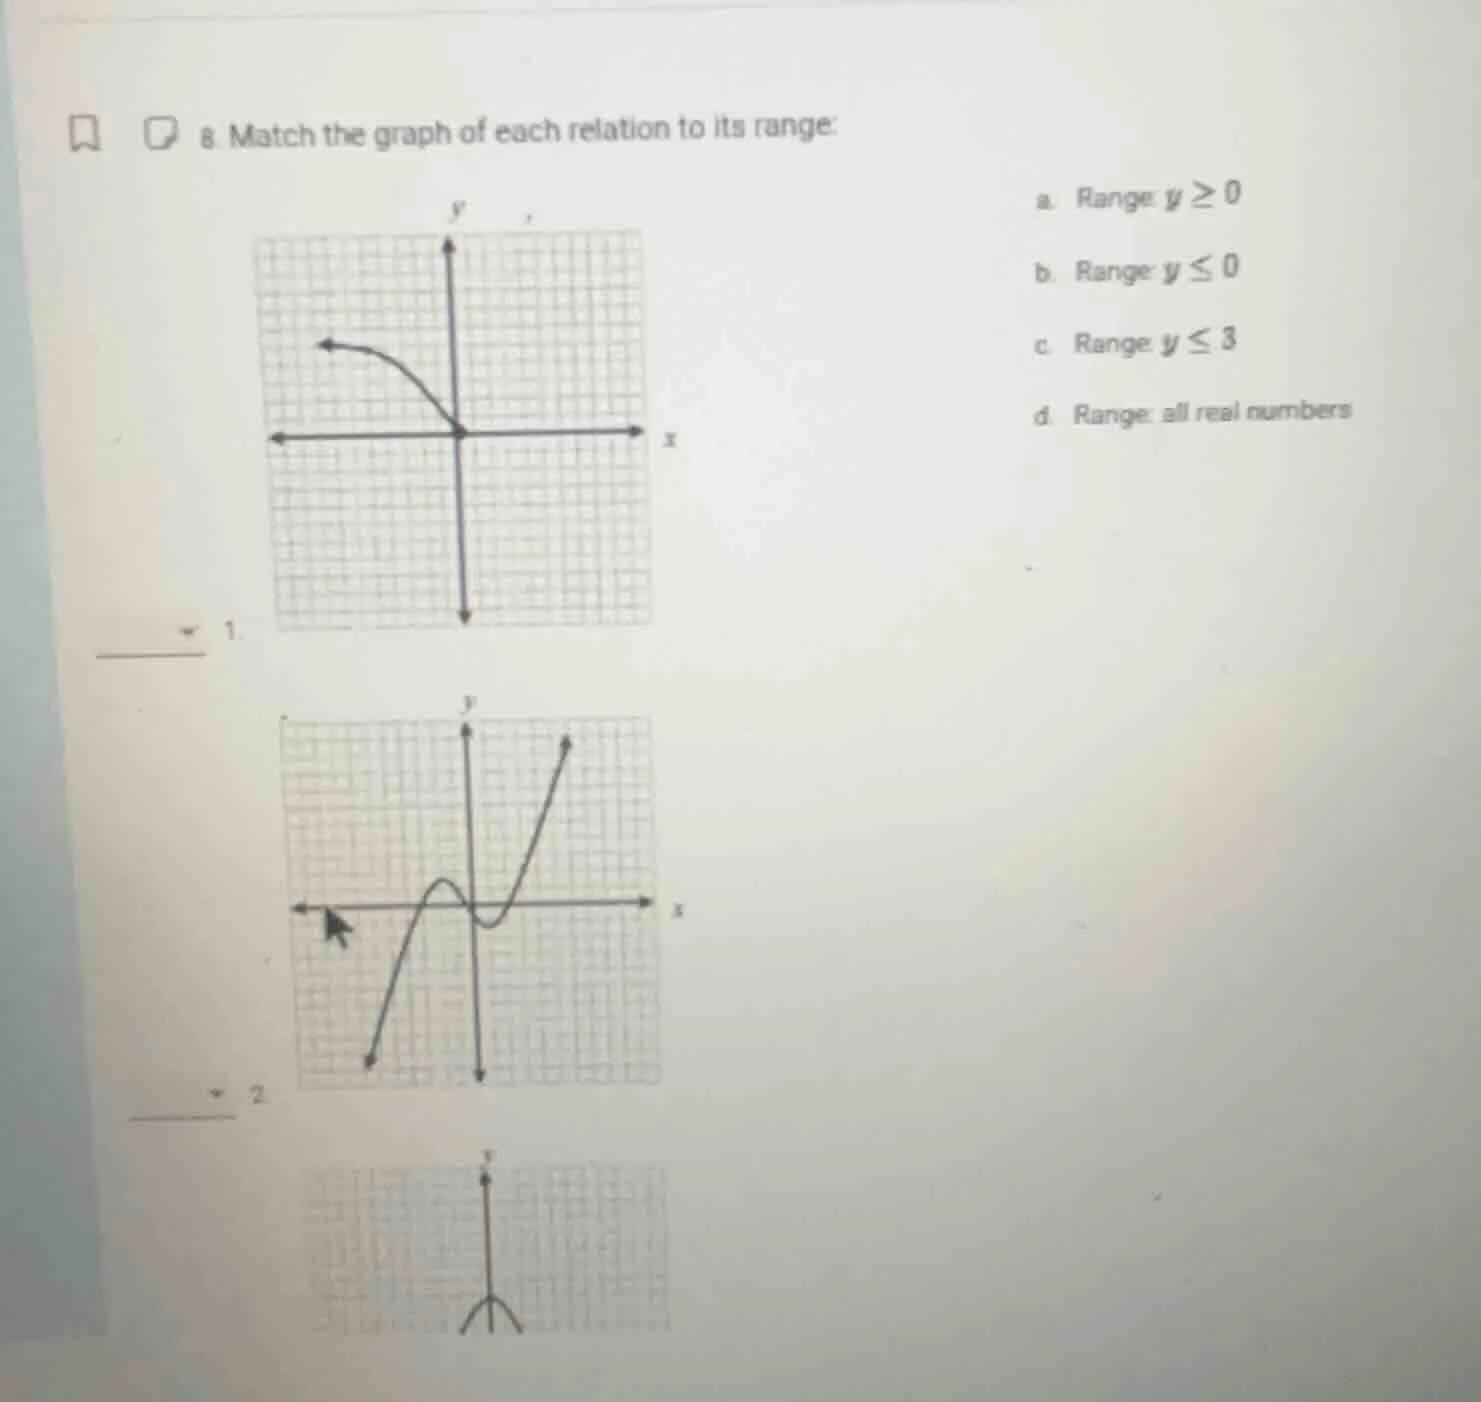
- match the graph of each relation to its range:
- graph of a curve starting at the origin and curving leftwards, staying above or at y=0
- graph of a polynomial - like curve with arrows pointing down and up, covering various y - values
range options:
a. range: ( y geq 0 )
b. range: ( y leq 0 )
c. range: ( y leq 3 )
d. range: all real numbers
For Graph 1:
Step1: Analyze the graph's y - values
The first graph (the curved one) has all its \( y \) - values greater than or equal to 0? Wait, no, looking at the direction: the curve is decreasing from the left, ending at the origin (0,0) and going down? Wait, no, the first graph: the curve is in the second quadrant (left of y - axis) and touches the origin. Wait, actually, the first graph (the upper left graph) has \( y \) - values that are less than or equal to 0? Wait, no, let's re - examine. Wait, the first graph (the one with the curve) has its highest point at the origin (0,0) and then goes down? No, the arrow is pointing left and down? Wait, no, the first graph: the curve is in the second quadrant, with the vertex at (0,0) and as \( x \) decreases (moves left), \( y \) stays at or below 0? Wait, no, the range is the set of all \( y \) - values the graph takes. For the first graph (the curved one), the \( y \) - values are all less than or equal to 0? Wait, no, maybe I made a mistake. Wait, the first graph: the curve is above the x - axis? No, the x - axis is the horizontal line. The first graph's curve is in the second quadrant, with the vertex at (0,0) and it's a downward - opening curve? Wait, no, the direction of the arrow: the arrow is pointing to the left and down? Wait, no, the first graph: the \( y \) - values are all non - positive? Wait, no, let's think again. Wait, the first graph (the upper left) has the curve starting from the left, curving down to (0,0). So the \( y \) - values are less than or equal to 0? Wait, no, if the curve is in the second quadrant (x negative, y positive) and ends at (0,0). Wait, maybe I messed up. Wait, the first graph: the \( y \) - values are all greater than or equal to 0? No, that can't be. Wait, the range options: a is \( y\geq0 \), b is \( y\leq0 \), c is \( y\leq3 \), d is all real numbers. Let's look at the first graph: the curve is in the second quadrant, with the vertex at (0,0) and as \( x \) decreases (moves left), \( y \) is positive and approaches 0? No, the arrow is pointing left and down, so maybe the \( y \) - values are less than or equal to 0? Wait, no, I think I made a mistake. Wait, the first graph (the curved one) has \( y \) - values that are less than or equal to 0? Wait, no, let's check the second graph. The second graph (the one with the wavy line and then increasing) has \( y \) - values that can be any real number (since it goes up and down, so range is all real numbers). The first graph: the curved graph, if it's a parabola opening downward with vertex at (0,0), then the range is \( y\leq0 \)? Wait, no, a downward - opening parabola with vertex at (0,0) has range \( y\leq0 \). Wait, but the first graph's curve is in the second quadrant, with the vertex at (0,0) and as \( x \) decreases, \( y \) decreases? No, a downward - opening parabola \( y=-x^{2} \) has vertex at (0,0) and range \( y\leq0 \). So the first graph (the curved one) has range \( y\leq0 \), so it matches option b.
Step2: Confirm the match
The first graph's \( y \) - values are all less than or equal to 0, so it matches range \( y\leq0 \) (option b).
For Graph 2:
Step1: Analyze the graph's y - values
The second graph (the wavy line that then increases) has \( y \) - values that can be any real number. Because the graph goes down (to negative \( y \) - values) and up (to positive \( y \) - values), so there are no restrictions on the \( y \) - values. So the range is all real numbers, which matches option d.

Snap & solve any problem in the app
Get step-by-step solutions on Sovi AI
Photo-based solutions with guided steps
Explore more problems and detailed explanations
for Graph 1: b. Range: \( y\leq0 \)