QUESTION IMAGE
Question
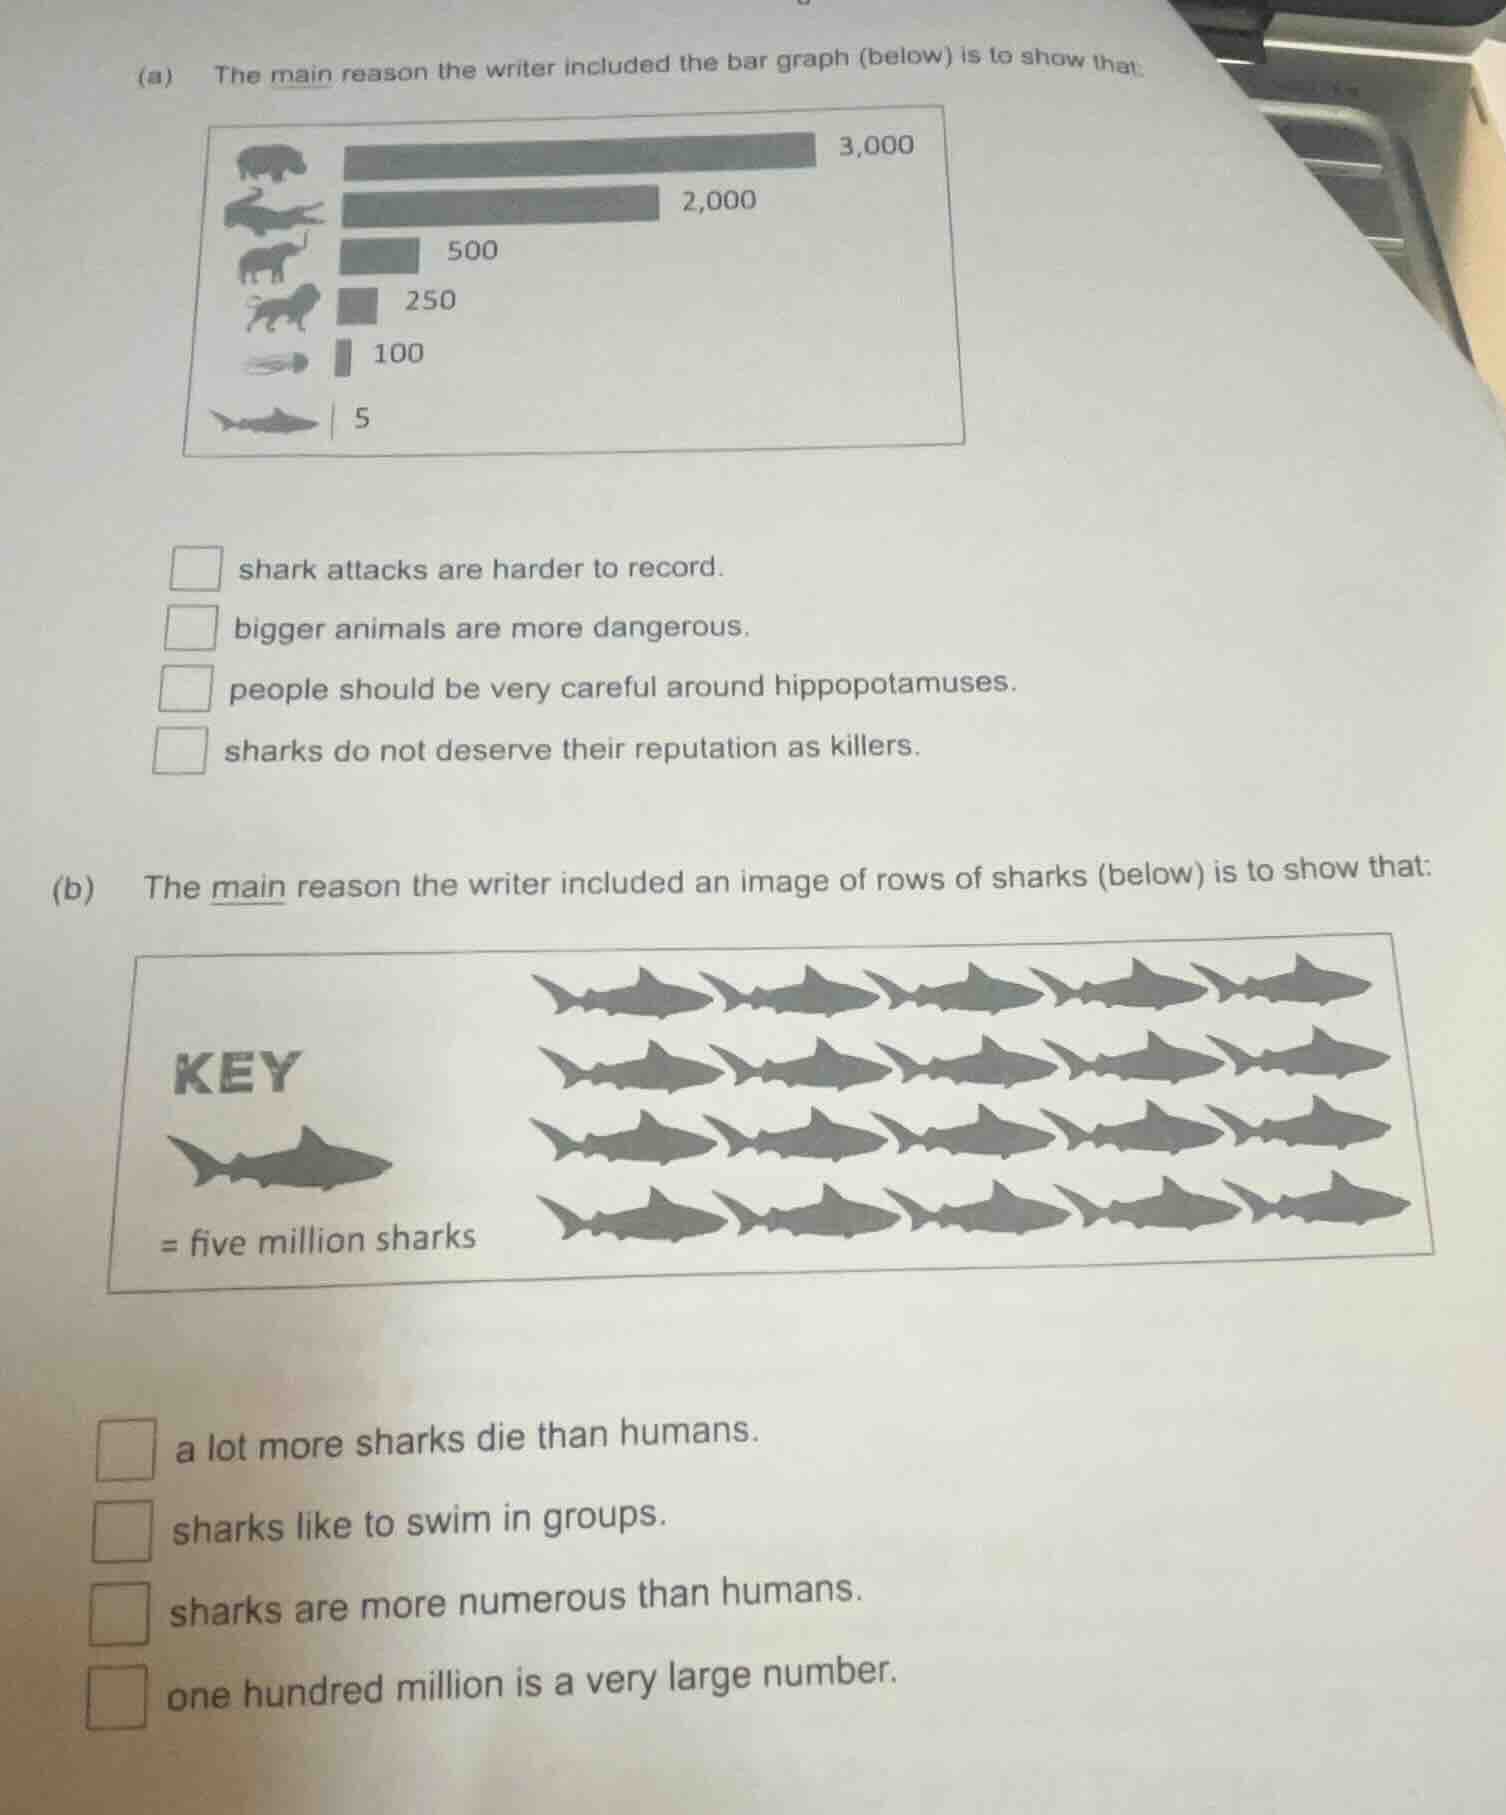
(a) the main reason the writer included the bar graph (below) is to show that:
shark attacks are harder to record.
bigger animals are more dangerous.
people should be very careful around hippopotamuses.
sharks do not deserve their reputation as killers.
(b) the main reason the writer included an image of rows of sharks (below) is to show that:
a lot more sharks die than humans.
sharks like to swim in groups.
sharks are more numerous than humans.
one hundred million is a very large number.
Analyze the bar graph in part (a)
The bar graph shows the number of deaths caused by different animals. At the top, we see animals causing 3,000, 2,000, 500, 250, and 100 deaths, while the shark at the very bottom is responsible for only 5 deaths. By comparing the extremely low number of shark-related deaths (5) to the other animals, the author uses this Authors Purpose to demonstrate that sharks do not deserve their reputation as deadly killers.
Analyze the pictogram in part (b)
The pictogram shows rows of sharks, where each shark icon represents five million sharks. There are 20 shark icons in total, representing 100 million sharks. This visual representation of a massive number of sharks is used to emphasize the scale of shark deaths or population decline compared to human deaths, showing that a lot more sharks die than humans.

Snap & solve any problem in the app
Get step-by-step solutions on Sovi AI
Photo-based solutions with guided steps
Explore more problems and detailed explanations
Question 1
- shark attacks are harder to record.
- bigger animals are more dangerous.
- people should be very careful around hippopotamuses.
- sharks do not deserve their reputation as killers. (Correct answer)
Question 2
- a lot more sharks die than humans. (Correct answer)
- sharks like to swim in groups.
- sharks are more numerous than humans.
- one hundred million is a very large number.