QUESTION IMAGE
Question
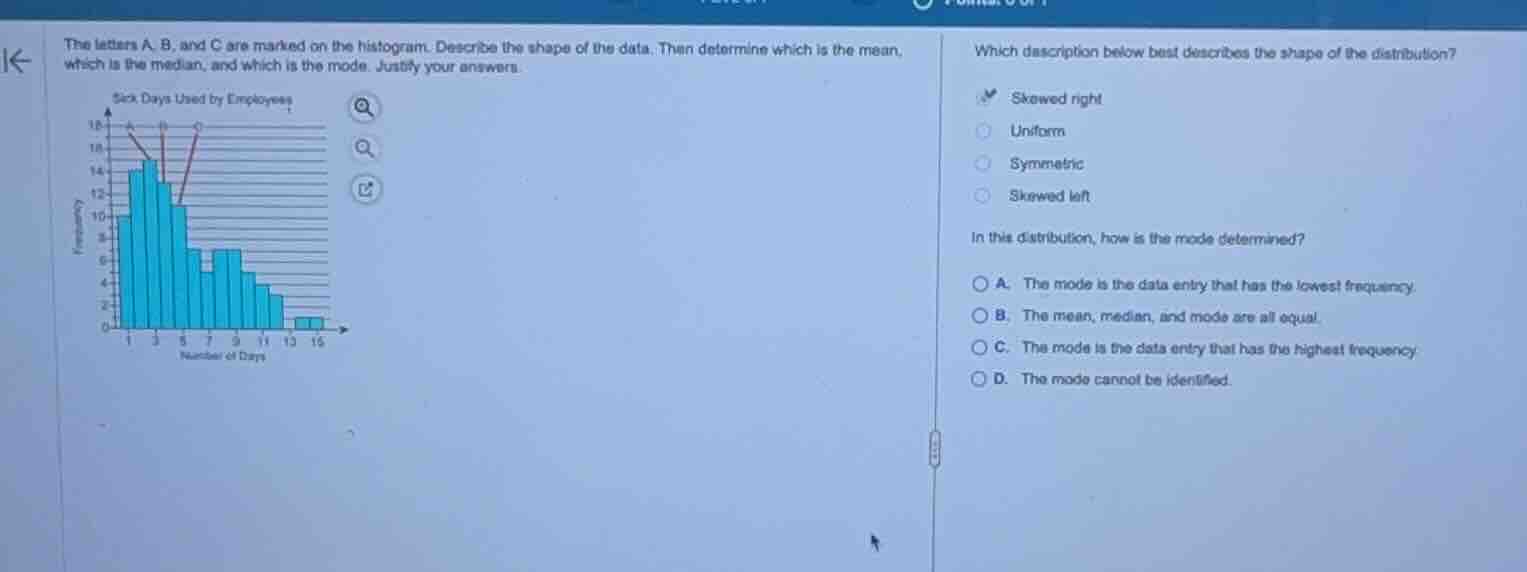
the letters a, b, and c are marked on the histogram. describe the shape of the data. then determine which is the mean, which is the median, and which is the mode. justify your answers.
which description below best describes the shape of the distribution?
- skewed right
- uniform
- symmetric
- skewed left
in this distribution, how is the mode determined?
a. the mode is the data entry that has the lowest frequency.
b. the mean, median, and mode are all equal.
c. the mode is the data entry that has the highest frequency.
d. the mode cannot be identified.
Analyze the distribution shape
Using the Histogram Shape Analysis knowledge point
- The histogram shows a peak on the left side (around 3 days) with a long tail extending to the right (up to 15 days).
- This asymmetric pattern with a tail stretching toward the larger values indicates a right-skewed distribution.
Determine the mode definition
Using the Measures of Central Tendency knowledge point
- The mode represents the value or category that occurs most frequently in a dataset.
- On a histogram, this corresponds directly to the tallest bar, representing the data entry with the highest frequency.

Snap & solve any problem in the app
Get step-by-step solutions on Sovi AI
Photo-based solutions with guided steps
Explore more problems and detailed explanations
Question 1
- Skewed right (Correct answer)
- Uniform
- Symmetric
- Skewed left
Question 2
- A. The mode is the data entry that has the lowest frequency.
- B. The mean, median, and mode are all equal.
- C. The mode is the data entry that has the highest frequency. (Correct answer)
- D. The mode cannot be identified.