QUESTION IMAGE
Question
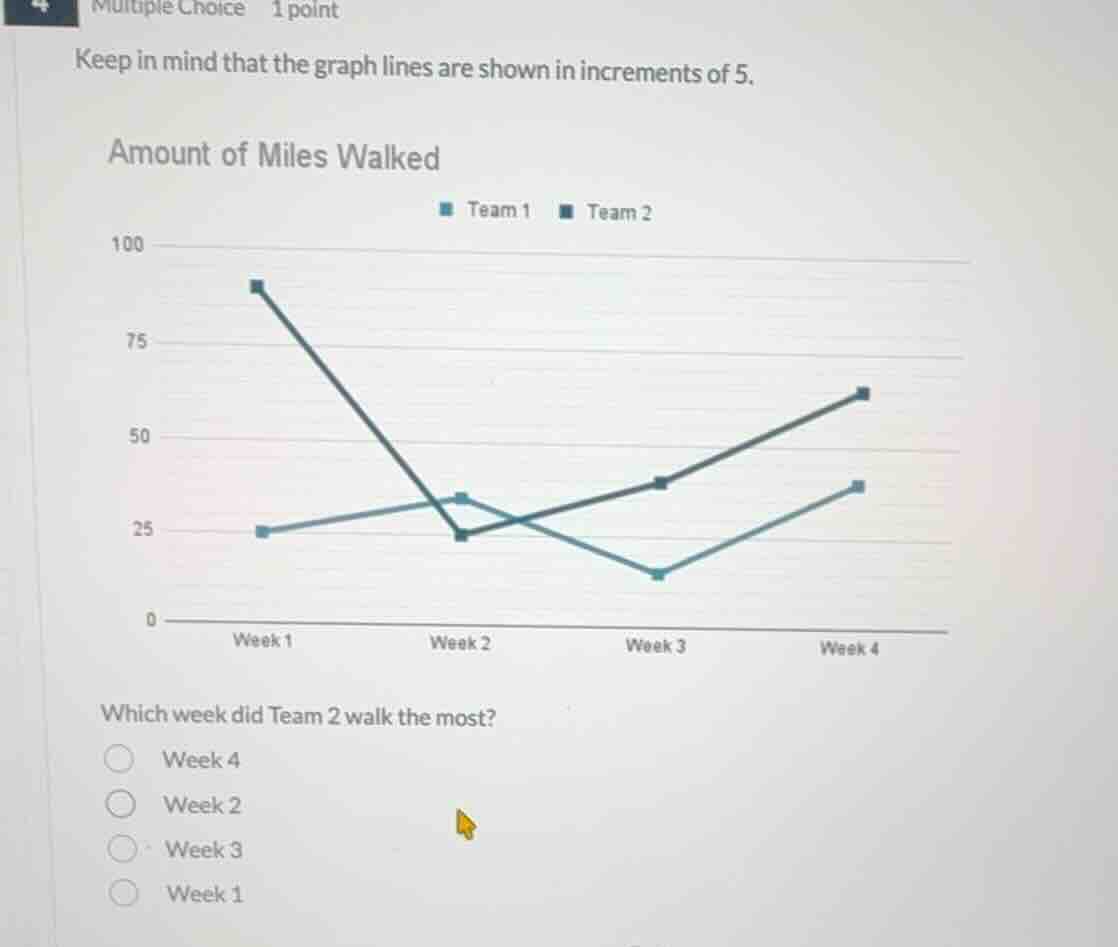
keep in mind that the graph lines are shown in increments of 5.
amount of miles walked
which week did team 2 walk the most?
week 4
week 2
week 3
week 1
Identify the line representing Team 2
The legend shows that Team 2 is represented by the dark blue/grey line (the line starting at approximately 90 in Week 1).
Read the values for Team 2 across all weeks
- Week 1: 90 miles
- Week 2: 23 miles
- Week 3: 38 miles
- Week 4: 62 miles
Determine the week with the maximum value
Comparing the values:
$$
90 > 62 > 38 > 23
$$
The highest value is 90 miles, which occurs in Week 1.

Snap & solve any problem in the app
Get step-by-step solutions on Sovi AI
Photo-based solutions with guided steps
Explore more problems and detailed explanations
- Week 4
- Week 2
- Week 3
- Week 1 (Correct answer)