QUESTION IMAGE
Question
Question was provided via image upload.
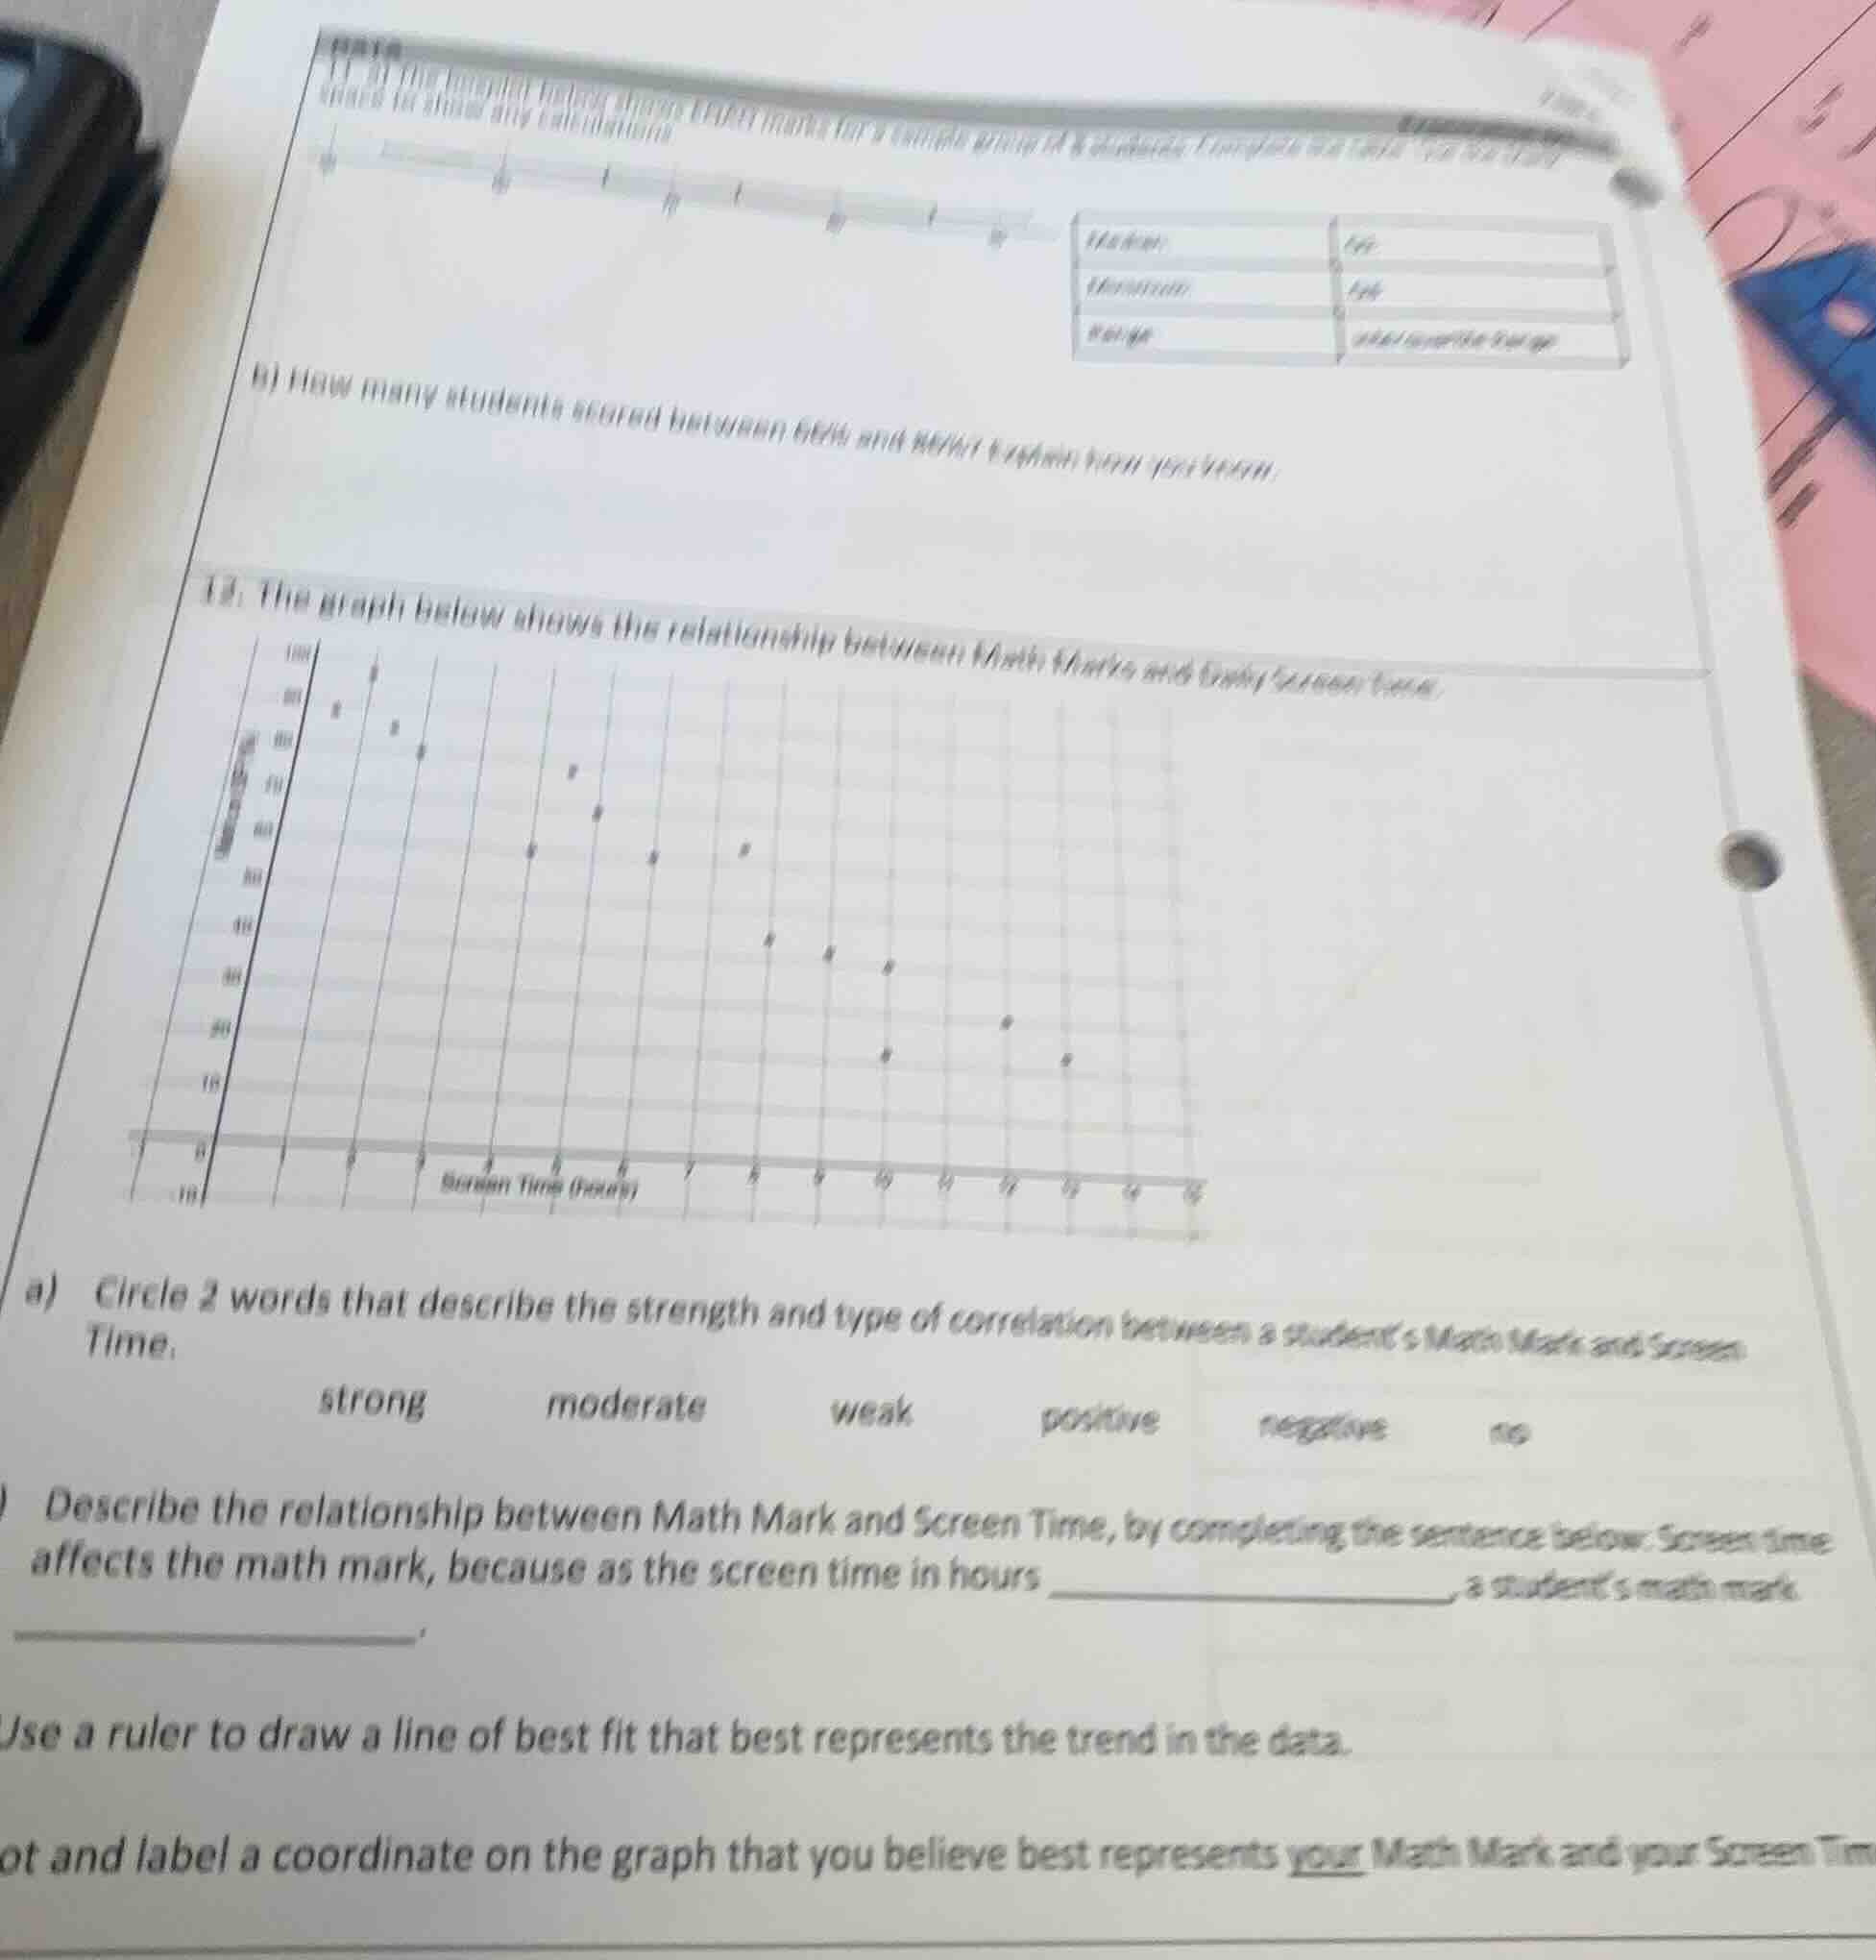
Analyze the scatter plot correlation
Complete the relationship sentence
Determine the line of best fit and coordinate placement

Snap & solve any problem in the app
Get step-by-step solutions on Sovi AI
Photo-based solutions with guided steps
Explore more problems and detailed explanations
Question a
The two words that describe the strength and type of correlation are:
moderate and negative
Question b
Screen time affects the math mark, because as the screen time in hours increases, a student's math mark decreases.
Question c
To draw the line of best fit, place a ruler on the graph so that it goes through the middle of the plotted points, balancing the number of points above and below the line. It should start around \( (0, 90) \) and slope downwards to around \( (9, 30) \).
Question d
A coordinate that represents a typical student's relationship on this graph is \( (3, 70) \) (representing 3 hours of screen time and a math mark of 70%).