QUESTION IMAGE
Question
Question was provided via image upload.
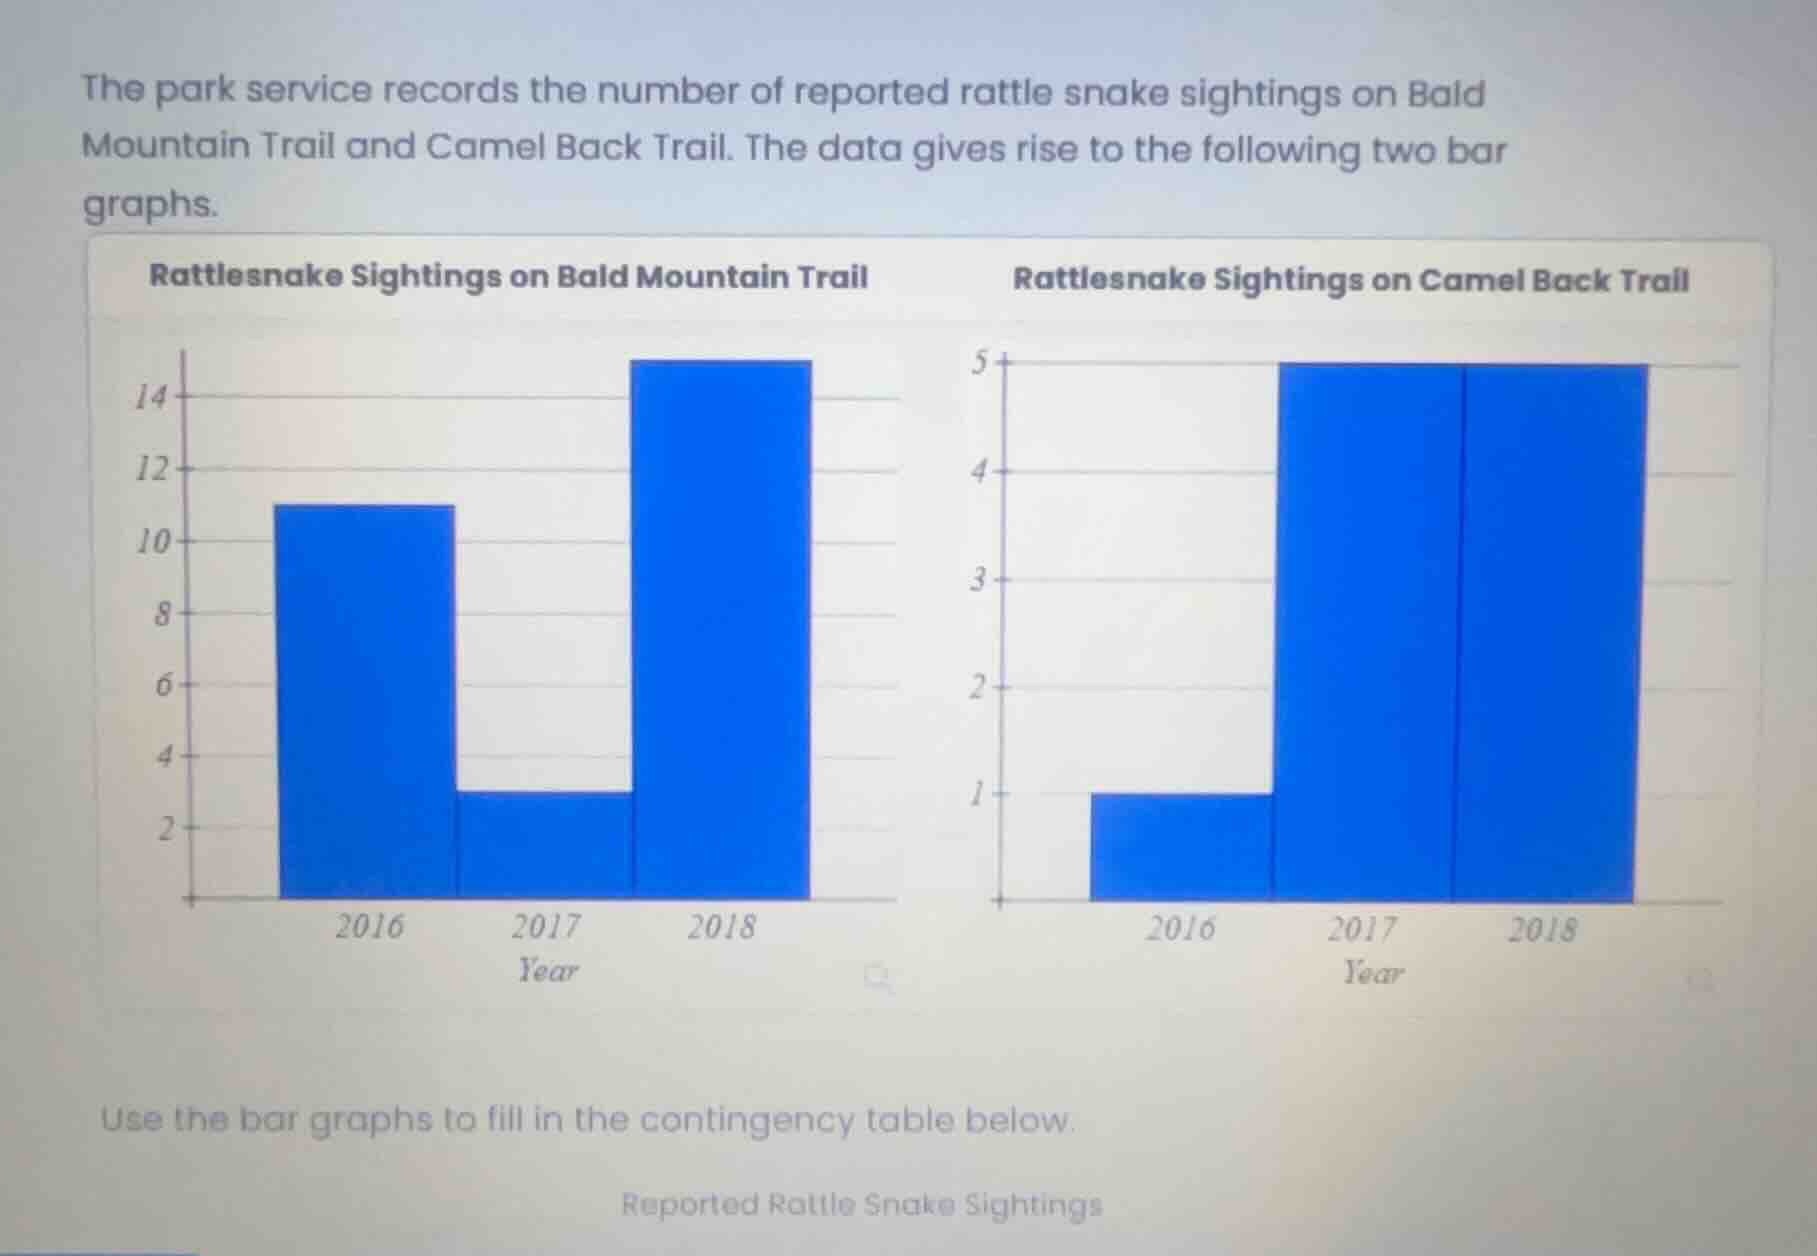
Extract data from Bald Mountain Trail bar graph
The first bar graph shows the sightings on Bald Mountain Trail:
- 2016: The bar reaches the line for \(11\).
- 2017: The bar reaches the line for \(3\).
- 2018: The bar reaches the line for \(15\).
Extract data from Camel Back Trail bar graph
The second bar graph shows the sightings on Camel Back Trail:
- 2016: The bar reaches the line for \(1\).
- 2017: The bar reaches the line for \(5\).
- 2018: The bar reaches the line for \(5\).
Construct the contingency table
We organize the extracted values into a two-way contingency table with trails as rows and years as columns.
- Bald Mountain Trail: \(11\) (2016), \(3\) (2017), \(15\) (2018).
- Camel Back Trail: \(1\) (2016), \(5\) (2017), \(5\) (2018).

Snap & solve any problem in the app
Get step-by-step solutions on Sovi AI
Photo-based solutions with guided steps
Explore more problems and detailed explanations
| Trail | 2016 | 2017 | 2018 |
|---|---|---|---|
| Camel Back Trail | 1 | 5 | 5 |