QUESTION IMAGE
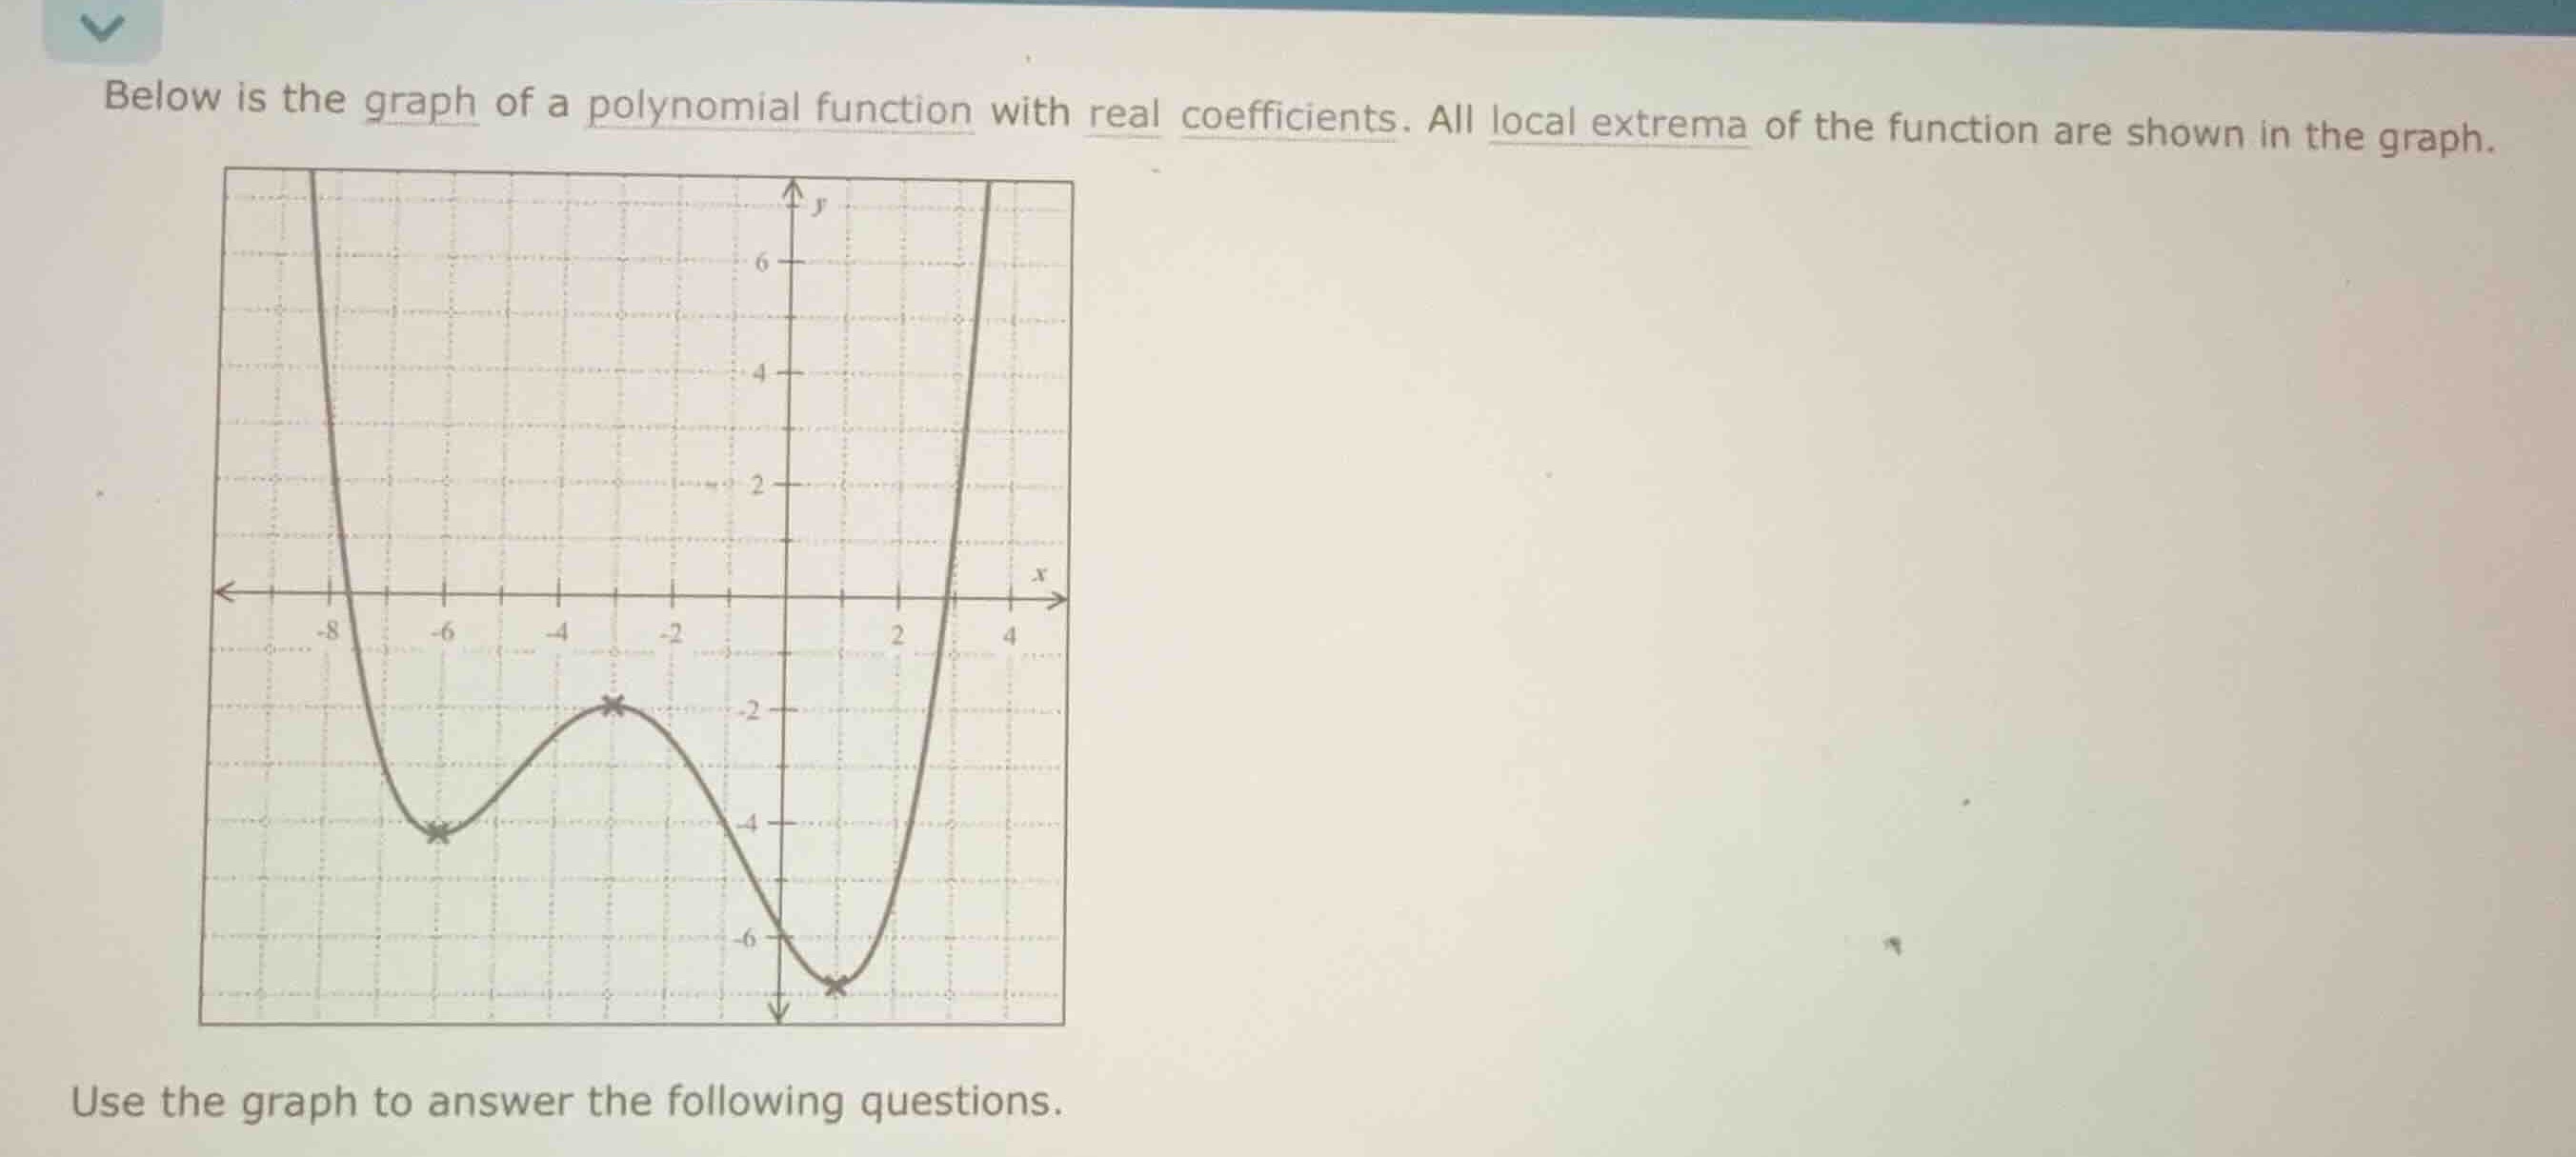
Question
Question was provided via image upload.
Identify local extrema coordinates from the graph
$$
LATEXBLOCK0
$$
Determine intervals of increase and decrease
$$
LATEXBLOCK1
$$
Analyze polynomial degree and leading coefficient
$$
LATEXBLOCK2
$$

Snap & solve any problem in the app
Get step-by-step solutions on Sovi AI
Photo-based solutions with guided steps
Explore more problems and detailed explanations
Based on the graph of the polynomial function:
- Local Extrema:
- Local minima occur at \(x = -6\) with value \(-4\), and at \(x = 1\) with value \(-7\).
- A local maximum occurs at \(x = -3\) with value \(-2\).
- Increasing and Decreasing Intervals:
- The function is increasing on the intervals \((-6, -3) \cup (1, \infty)\).
- The function is decreasing on the intervals \((-\infty, -6) \cup (-3, 1)\).
- Degree and Leading Coefficient:
- Since there are 3 local extrema, the polynomial has a minimum degree of 4 (even degree).
- Since both ends of the graph point upwards (\(y \to \infty\) as \(x \to \pm\infty\)), the leading coefficient is positive.