QUESTION IMAGE
Question
Question was provided via image upload.
Identify variables and domain
Using the Independent and Dependent Variables and Domain and Range knowledge points
- Independent variable \(p\): price of gasoline per gallon.
- Dependent variable \(t\): number of tourists in a national park.
- Given domain: numbers of tourists visiting the park or \(0\) people to \(1\) million people is incorrect because tourists depend on gas price. The domain is the independent variable \(p\), which represents realistic gasoline prices, specifically \(0.25\) to \(1.50\) dollars per gallon (based on the graph axes).
Determine the range
Using the Domain and Range knowledge point
- The range represents the dependent variable, which is the number of tourists \(t\).
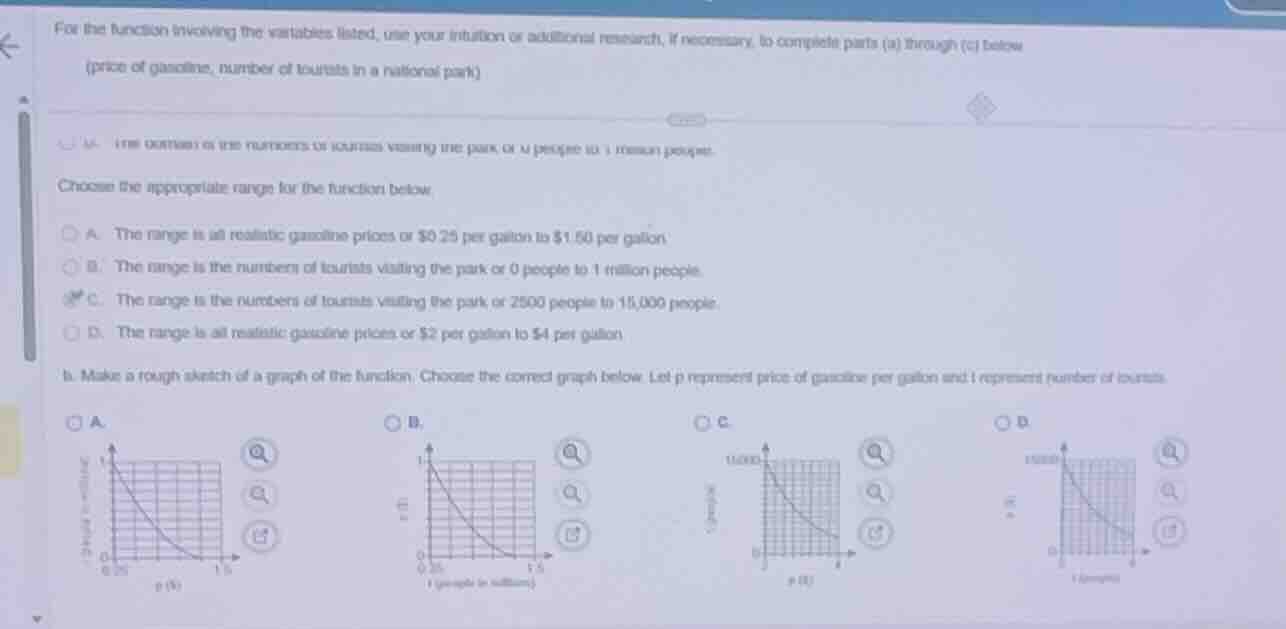
- Looking at the options, option C states: "The range is the numbers of tourists visiting the park or 2500 people to 15,000 people."
- This matches the dependent variable and realistic tourist numbers shown on the vertical axes of the correct graphs.
Analyze the relationship
Using the Independent and Dependent Variables knowledge point
- As the price of gasoline \(p\) increases, travel becomes more expensive.
- Therefore, the number of tourists \(t\) visiting a national park is expected to decrease.
- This represents a negative relationship (downward-sloping curve).
Select the correct graph
Using the Function Representation knowledge point
- The independent variable \(p\) (price of gasoline in dollars) must be on the horizontal axis.
- The dependent variable \(t\) (number of tourists) must be on the vertical axis.
- The curve must slope downward from left to right.
- Graph C has \(p\) (\$) on the horizontal axis, \(t\) (tourists, from \(0\) to \(15,000\)) on the vertical axis, and a downward-sloping curve.

Snap & solve any problem in the app
Get step-by-step solutions on Sovi AI
Photo-based solutions with guided steps
Explore more problems and detailed explanations
Question 1
- (A) The range is all realistic gasoline prices or $0.25 per gallon to $1.50 per gallon.
- (B) The range is the numbers of tourists visiting the park or 0 people to 1 million people.</mcq-correct>
- (C) The range is the numbers of tourists visiting the park or 2500 people to 15,000 people. (Correct answer)
<mcq-option>(D) The range is all realistic gasoline prices or $2 per gallon to $4 per gallon.
Question 2
- (A) Graph with tourists on the horizontal axis and price on the vertical axis.
- (B) Graph with tourists on the horizontal axis and price on the vertical axis (different scale).
- (C) Graph with price \(p\) on the horizontal axis and tourists \(t\) on the vertical axis, showing a downward-sloping curve. (Correct answer)
- (D) Graph with price \(p\) on the horizontal axis and tourists \(t\) on the vertical axis, showing an upward-sloping curve.