QUESTION IMAGE
Question
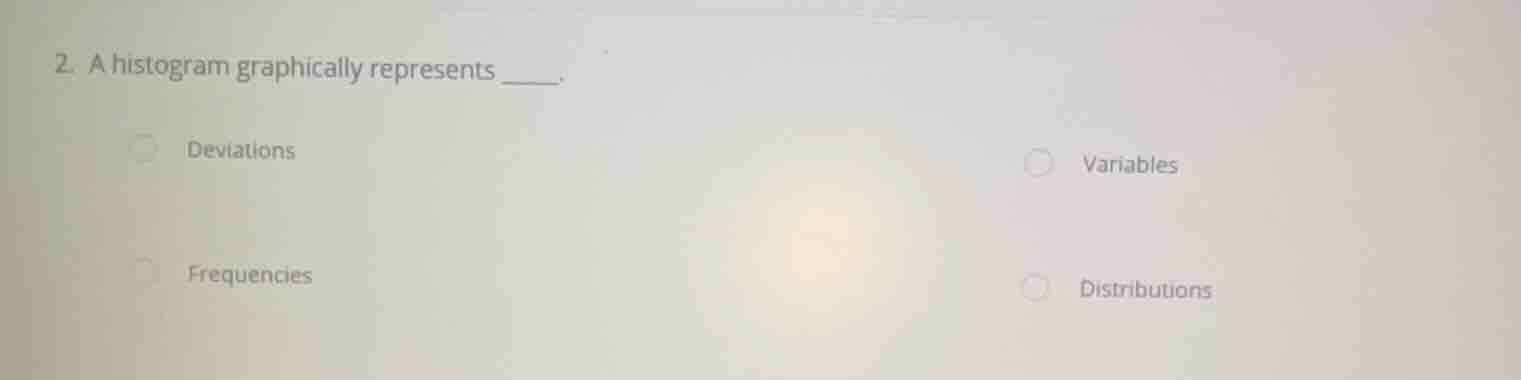
- a histogram graphically represents ______.
deviations
variables
frequencies
distributions
Analyze the definition of a histogram
A histogram is a graphical representation of a grouped frequency distribution with continuous classes. The heights of the bars represent the frequencies of the corresponding class intervals.
Evaluate the given options
- Deviations: Histograms do not directly represent deviations from a mean.
- Variables: While it plots a variable on the horizontal axis, it is not a representation of variables themselves.
- Frequencies: The primary purpose of the bars in a histogram is to show the frequency of data points within each interval.
- Distributions: A histogram represents the overall distribution, but specifically, it graphically represents frequencies across intervals. In standard statistical definitions, a histogram graphically represents frequencies.

Snap & solve any problem in the app
Get step-by-step solutions on Sovi AI
Photo-based solutions with guided steps
Explore more problems and detailed explanations
- Deviations
- Frequencies (Correct answer)
- Variables
- Distributions