QUESTION IMAGE
Question
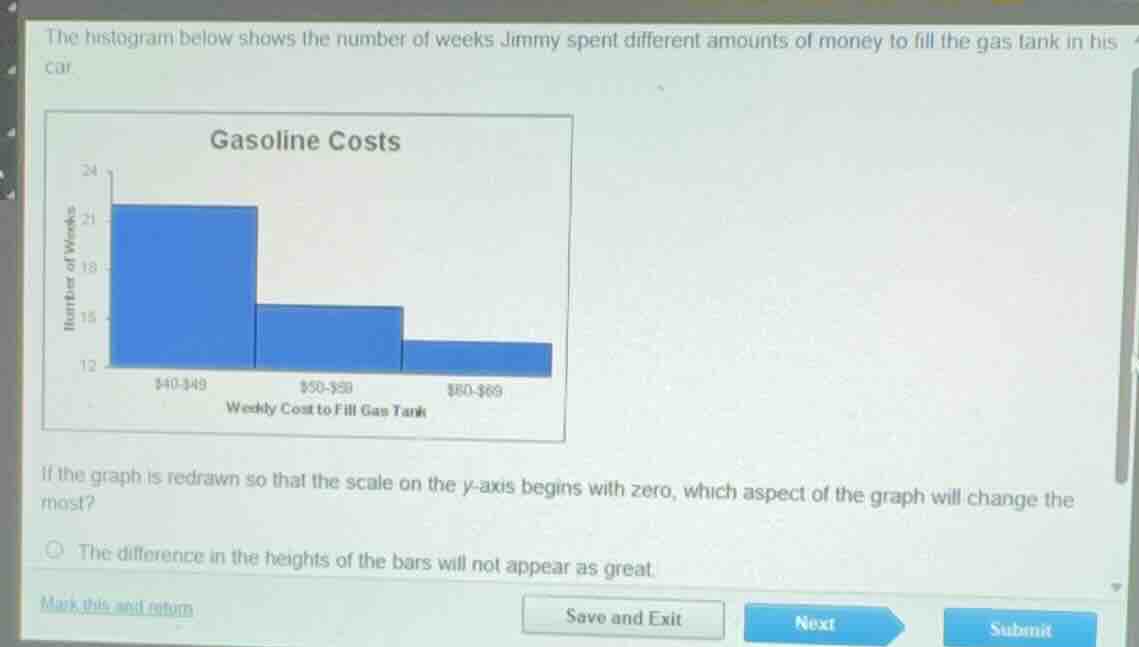
the histogram below shows the number of weeks jimmy spent different amounts of money to fill the gas tank in his car.
gasoline costs
weekly cost to fill gas tank
if the graph is redrawn so that the scale on the y-axis begins with zero, which aspect of the graph will change the most?
the difference in the heights of the bars will not appear as great.
Analyze the current graph scale
Using the Truncated Graphs knowledge point
The current \(y\)-axis (Number of Weeks) starts at 12 instead of 0. This truncation exaggerates the relative differences in heights between the bars.
Evaluate the effect of starting at zero
Using the Misleading Graphs knowledge point
Redrawing the scale to start at zero increases the total vertical range of the axis. This compression makes the relative differences in the heights of the bars appear much smaller and more accurate.

Snap & solve any problem in the app
Get step-by-step solutions on Sovi AI
Photo-based solutions with guided steps
Explore more problems and detailed explanations
- The difference in the heights of the bars will not appear as great. (Correct answer)