QUESTION IMAGE
Question
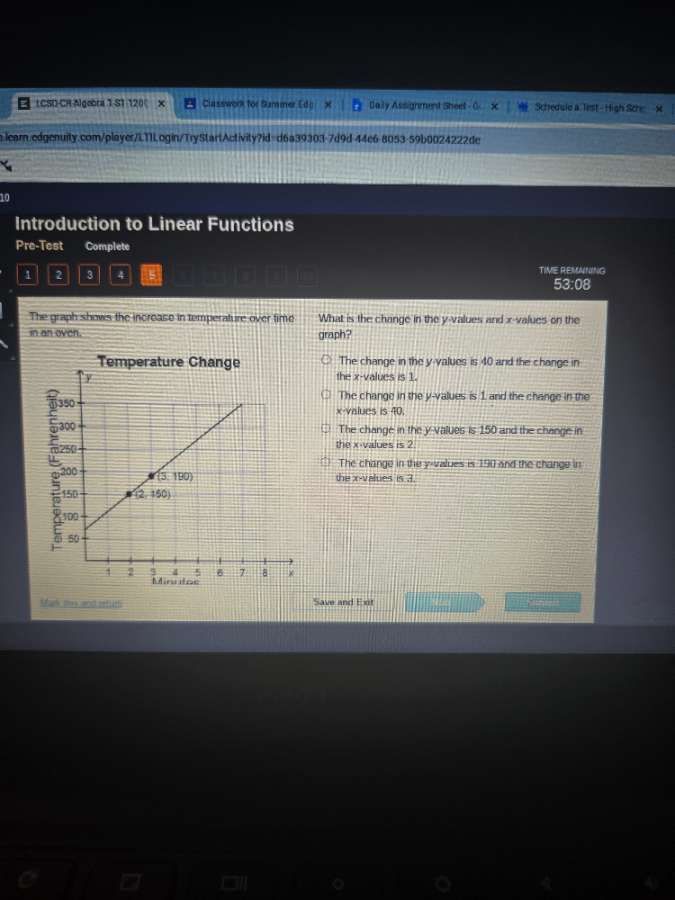
the graph shows the increase in temperature over time in an oven.
what is the change in the \\(y\\)-values and \\(x\\)-values on the graph?
- the change in the \\(y\\)-values is 40 and the change in the \\(x\\)-values is 1.
- the change in the \\(y\\)-values is 1 and the change in the \\(x\\)-values is 40.
- the change in the \\(y\\)-values is 150 and the change in the \\(x\\)-values is 2.
- the change in the \\(y\\)-values is 190 and the change in the \\(x\\)-values is 3.
⚡ Using what you learned: Rate of Change and Applications
Step 1: Identify the given points
Identify the coordinates of the two plotted points on the line:
- Point 1: \((2, 150)\)
- Point 2: \((3, 190)\)
Step 2: Calculate the change in \(y\)-values
Subtract the \(y\)-coordinate of the first point from the \(y\)-coordinate of the second point:
$$\text{Change in } y = 190 - 150 = 40$$
Step 3: Calculate the change in \(x\)-values
Subtract the \(x\)-coordinate of the first point from the \(x\)-coordinate of the second point:
$$\text{Change in } x = 3 - 2 = 1$$

Snap & solve any problem in the app
Get step-by-step solutions on Sovi AI
Photo-based solutions with guided steps
Explore more problems and detailed explanations
The change in the \(y\)-values is 40 and the change in the \(x\)-values is 1.