QUESTION IMAGE
Question
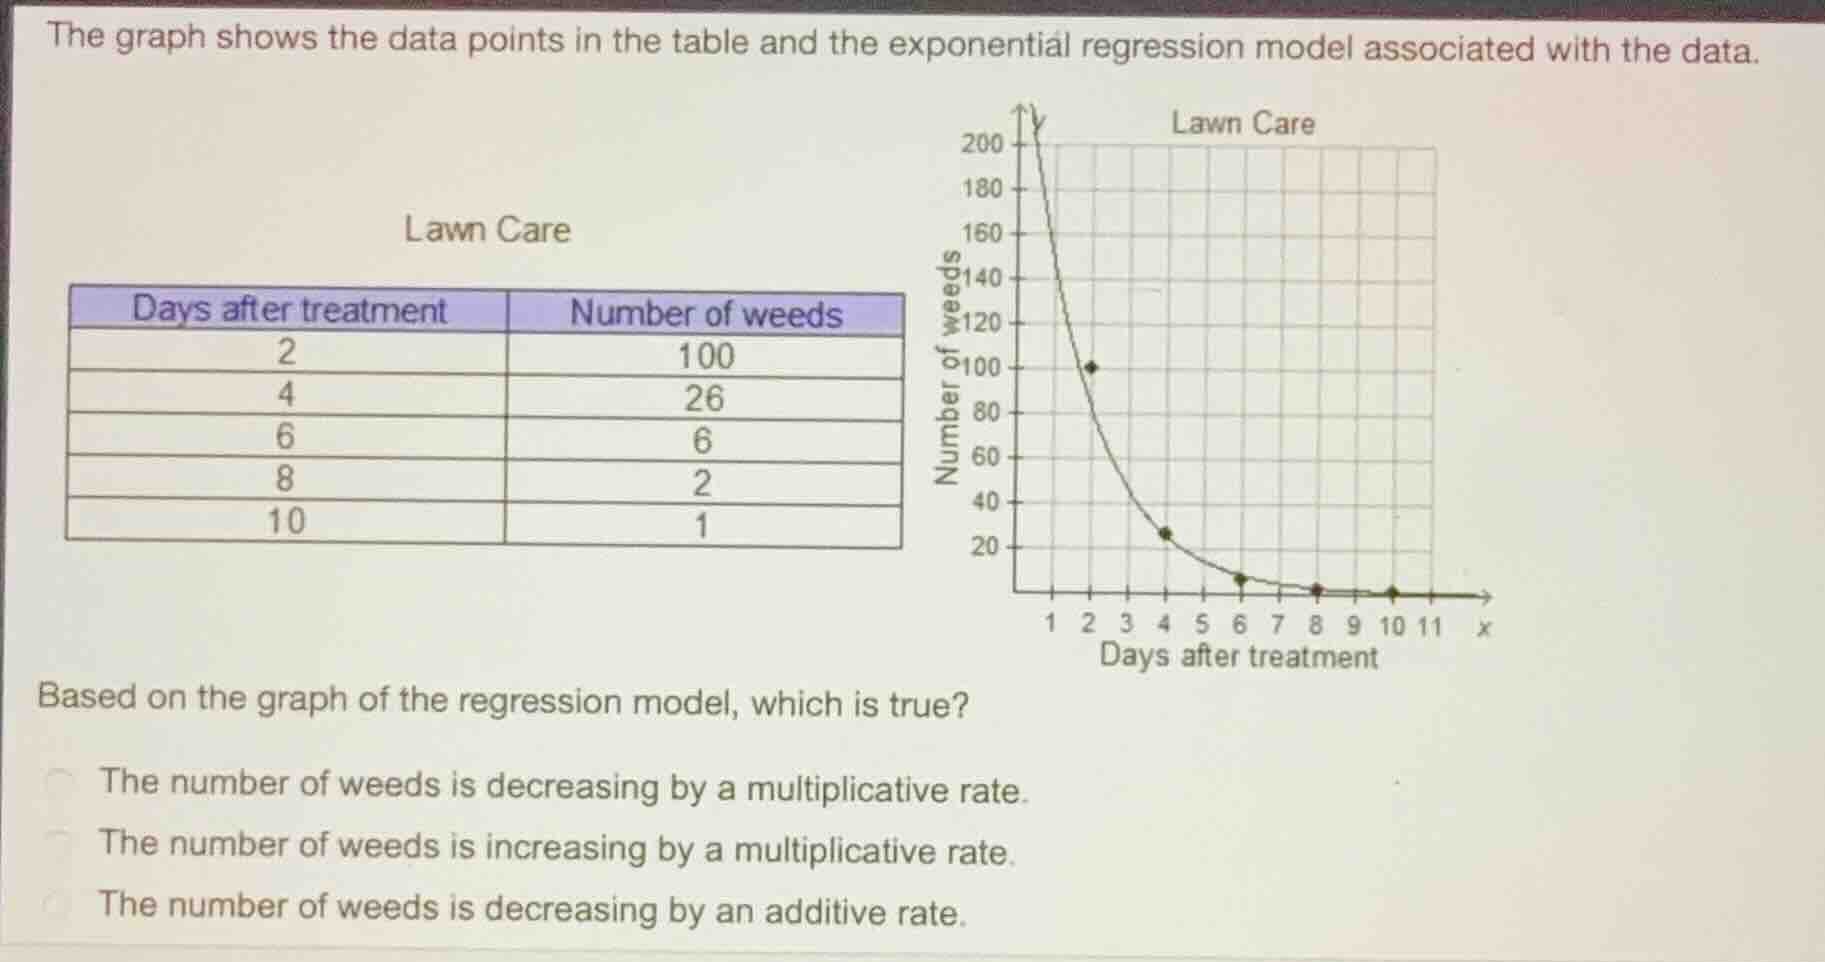
the graph shows the data points in the table and the exponential regression model associated with the data.
based on the graph of the regression model, which is true?
the number of weeds is decreasing by a multiplicative rate.
the number of weeds is increasing by a multiplicative rate.
the number of weeds is decreasing by an additive rate.
Analyze the trend of the data
The number of weeds decreases as the number of days after treatment increases (from 100 to 26, then 6, 2, and 1).
Determine the rate type
An exponential model represents a quantity changing by a constant percentage or multiplicative factor over equal intervals, rather than a constant additive amount. Since the model is exponential and the values are decreasing, the number of weeds is decreasing by a multiplicative rate.

Snap & solve any problem in the app
Get step-by-step solutions on Sovi AI
Photo-based solutions with guided steps
Explore more problems and detailed explanations
- The number of weeds is decreasing by a multiplicative rate. (Correct answer)
- The number of weeds is increasing by a multiplicative rate.
- The number of weeds is decreasing by an additive rate.