QUESTION IMAGE
Question
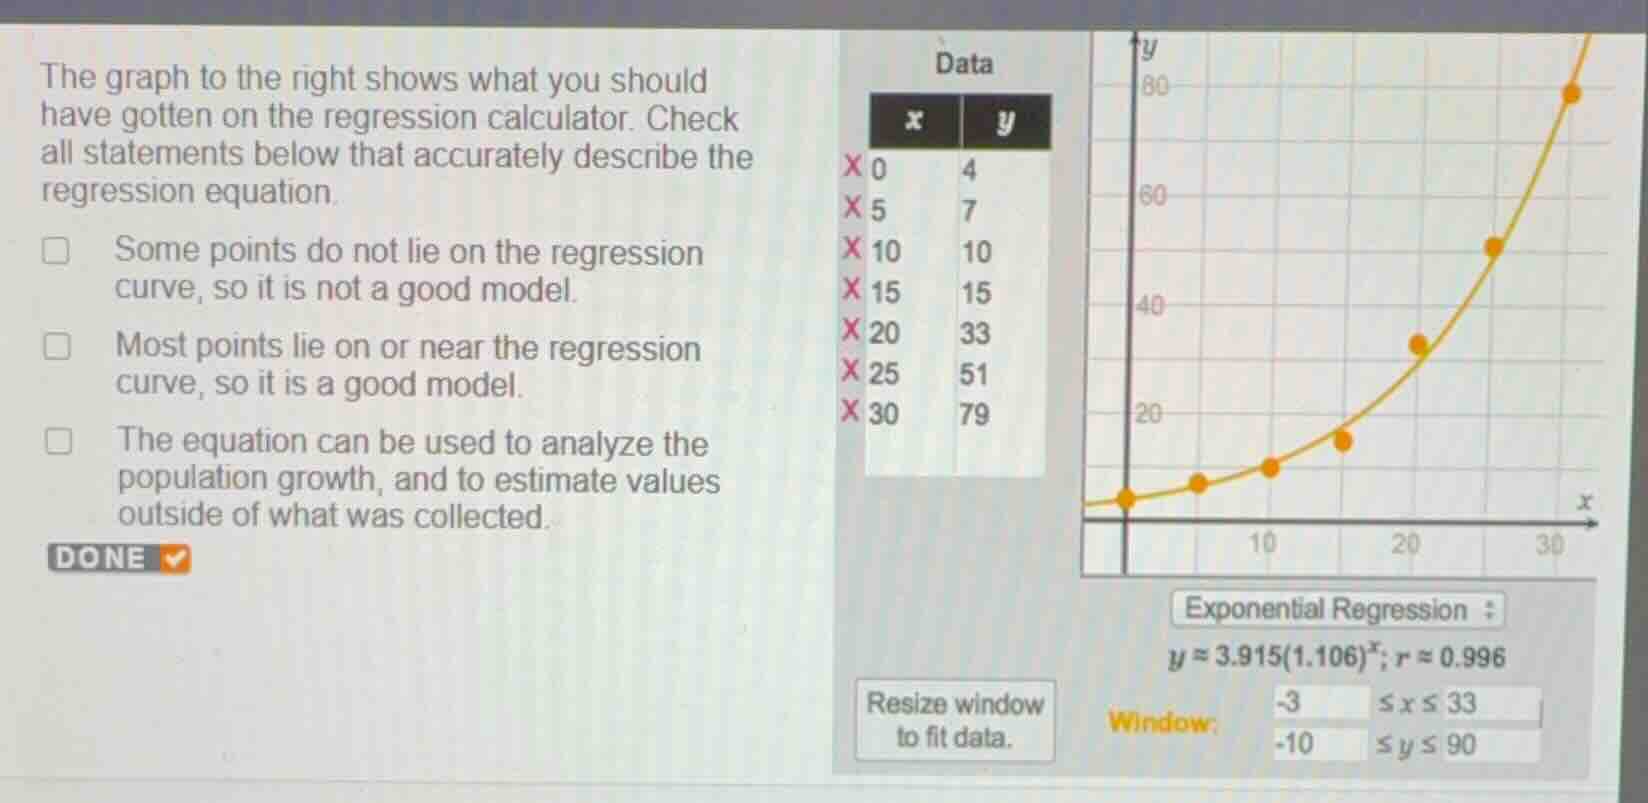
the graph to the right shows what you should have gotten on the regression calculator. check all statements below that accurately describe the regression equation.
- some points do not lie on the regression curve, so it is not a good model.
- most points lie on or near the regression curve, so it is a good model.
- the equation can be used to analyze the population growth, and to estimate values outside of what was collected.
Analyze model fit using correlation coefficient
Using the Correlation Coefficient knowledge point
The correlation coefficient \(r \approx 0.996\) is extremely close to \(1\). This indicates an exceptionally strong positive exponential relationship between \(x\) and \(y\).
Evaluate point proximity to the curve
Using the Exponential Regression knowledge point
Looking at the graph, almost all the data points lie directly on or extremely close to the regression curve. Therefore, the first statement is incorrect, and the second statement is correct.
Assess model utility for prediction
Using the Exponential Regression knowledge point
Since the exponential regression model fits the data very well, the equation can be used to model the growth trend and make predictions (extrapolations) for values outside the collected data range. Thus, the third statement is correct.

Snap & solve any problem in the app
Get step-by-step solutions on Sovi AI
Photo-based solutions with guided steps
Explore more problems and detailed explanations
- Some points do not lie on the regression curve, so it is not a good model.
- Most points lie on or near the regression curve, so it is a good model. (Correct answer)
- The equation can be used to analyze the population growth, and to estimate values outside of what was collected. (Correct answer)