QUESTION IMAGE
Question
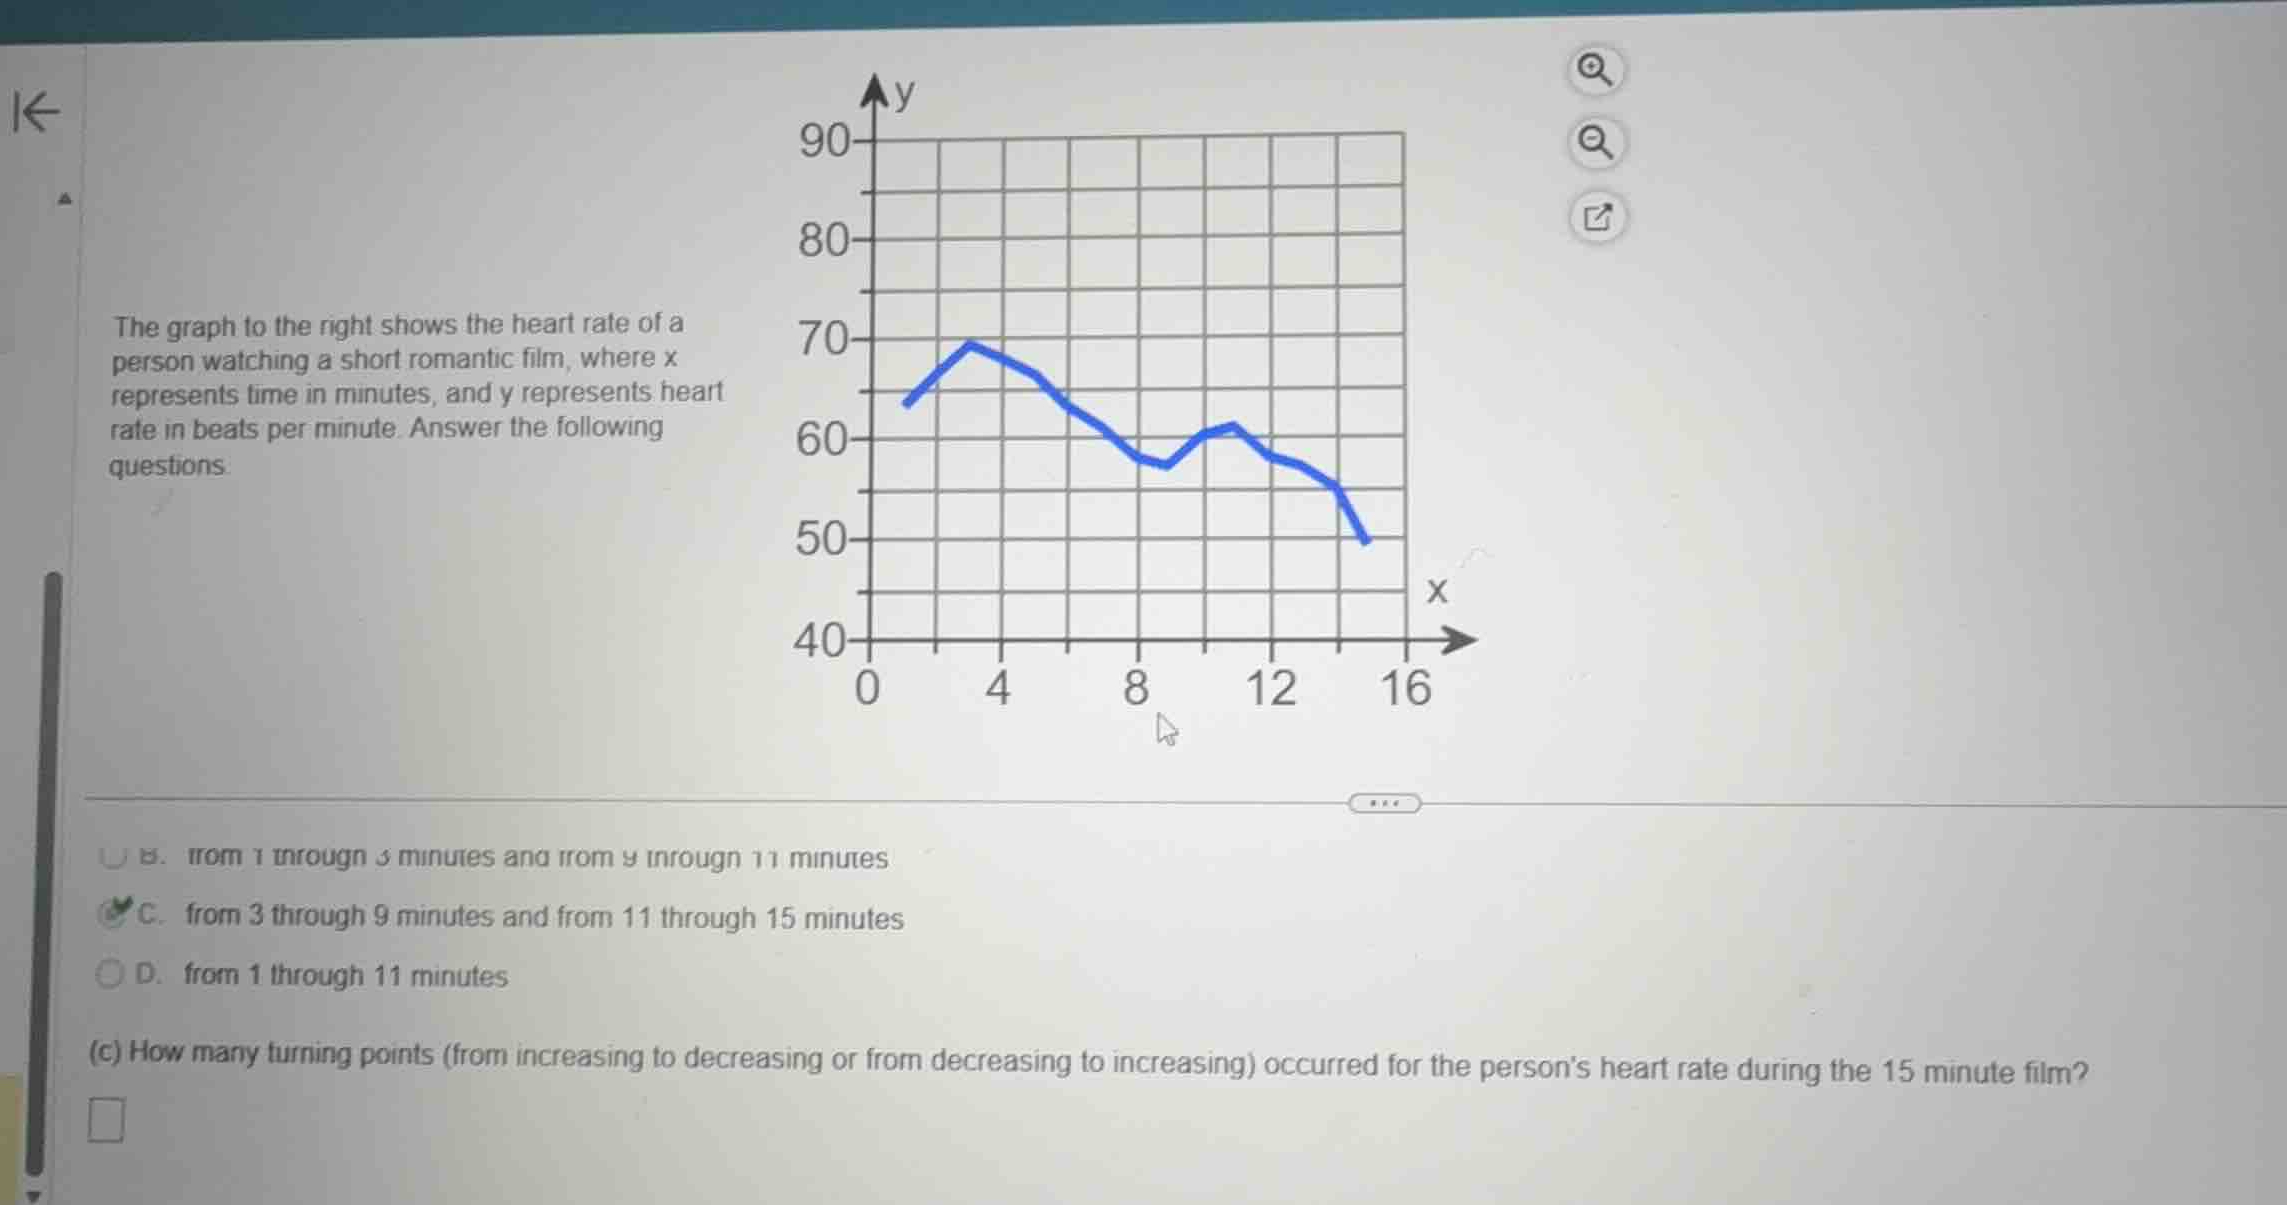
the graph to the right shows the heart rate of a person watching a short romantic film, where x represents time in minutes, and y represents heart rate in beats per minute. answer the following questions.
(c) how many turning points (from increasing to decreasing or from decreasing to increasing) occurred for the persons heart rate during the 15 minute film?
Identify the intervals of increase and decrease
Using the Increasing Intervals and Decreasing Intervals knowledge points
- From \(x = 1\) to \(x = 3\), the graph rises (increasing).
- From \(x = 3\) to \(x = 9\), the graph falls (decreasing).
- From \(x = 9\) to \(x = 11\), the graph rises (increasing).
- From \(x = 11\) to \(x = 15\), the graph falls (decreasing).
Locate the turning points
Using the Graph Interpretation knowledge point
- A turning point occurs where the function changes from increasing to decreasing, or from decreasing to increasing.
- The first change occurs at \(x = 3\) (increasing to decreasing).
- The second change occurs at \(x = 9\) (decreasing to increasing).
- The third change occurs at \(x = 11\) (increasing to decreasing).
Count the total turning points
- There are exactly 3 turning points on the interval from \(x = 1\) to \(x = 15\).

Snap & solve any problem in the app
Get step-by-step solutions on Sovi AI
Photo-based solutions with guided steps
Explore more problems and detailed explanations
(c) How many turning points (from increasing to decreasing or from decreasing to increasing) occurred for the person's heart rate during the 15 minute film?
<blank>3</blank>