QUESTION IMAGE
Question
graph.
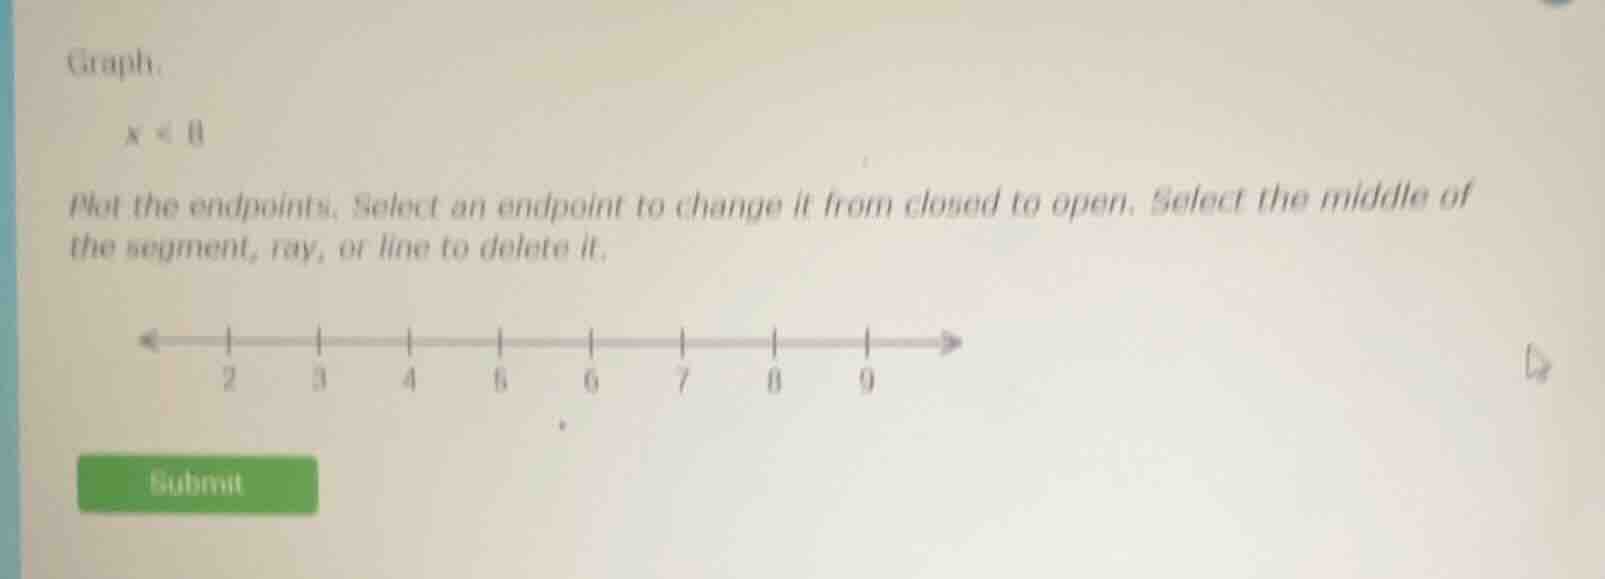
\\(x < 8\\)
plot the endpoints. select an endpoint to change it from closed to open. select the middle of the segment, ray, or line to delete it.
Identify the inequality and boundary
$$
x < 8
$$
Determine endpoint type and direction
$$
LATEXBLOCK0
$$

Snap & solve any problem in the app
Get step-by-step solutions on Sovi AI
Photo-based solutions with guided steps
Explore more problems and detailed explanations
To graph \(x < 8\) on the number line:
- Place an open circle at \(8\).
- Draw a ray pointing to the left from \(8\).