QUESTION IMAGE
Question
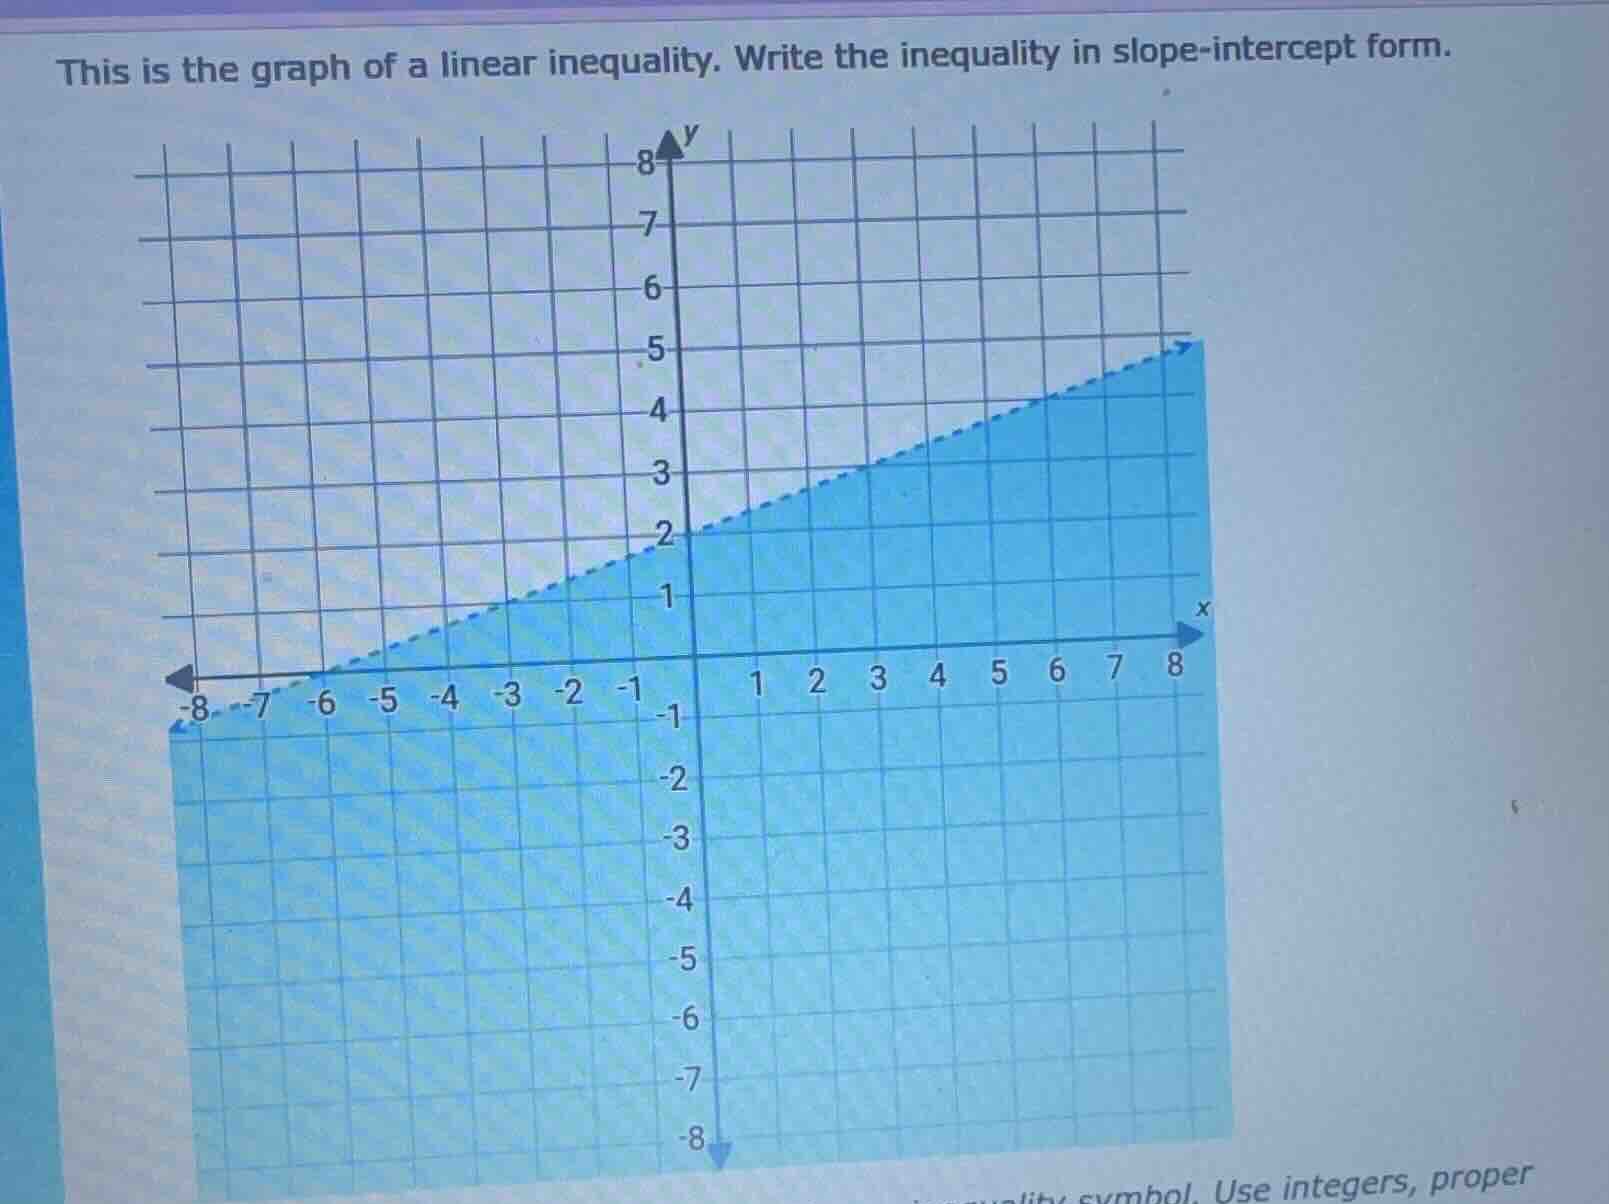
this is the graph of a linear inequality. write the inequality in slope - intercept form.
(the chart is a coordinate grid with a linear inequality graph, and there is a note at the bottom: use integers, proper (the rest is cut off))
Step1: Find the slope of the line
The line passes through \((0, 2)\) and \((-6, 0)\). The slope \(m\) is calculated as \(m=\frac{y_2 - y_1}{x_2 - x_1}=\frac{2 - 0}{0 - (-6)}=\frac{2}{6}=\frac{1}{3}\).
Step2: Determine the y - intercept
The line crosses the y - axis at \((0, 2)\), so the y - intercept \(b = 2\). The equation of the line in slope - intercept form (\(y=mx + b\)) is \(y=\frac{1}{3}x+2\).
Step3: Determine the inequality symbol
The line is dashed (so the inequality is strict, no equal sign) and the shaded region is above the line. For a line \(y = mx + b\), if the shaded region is above the line, the inequality is \(y>mx + b\). So the inequality is \(y>\frac{1}{3}x + 2\).

Snap & solve any problem in the app
Get step-by-step solutions on Sovi AI
Photo-based solutions with guided steps
Explore more problems and detailed explanations
\(y>\frac{1}{3}x + 2\)