QUESTION IMAGE
Question
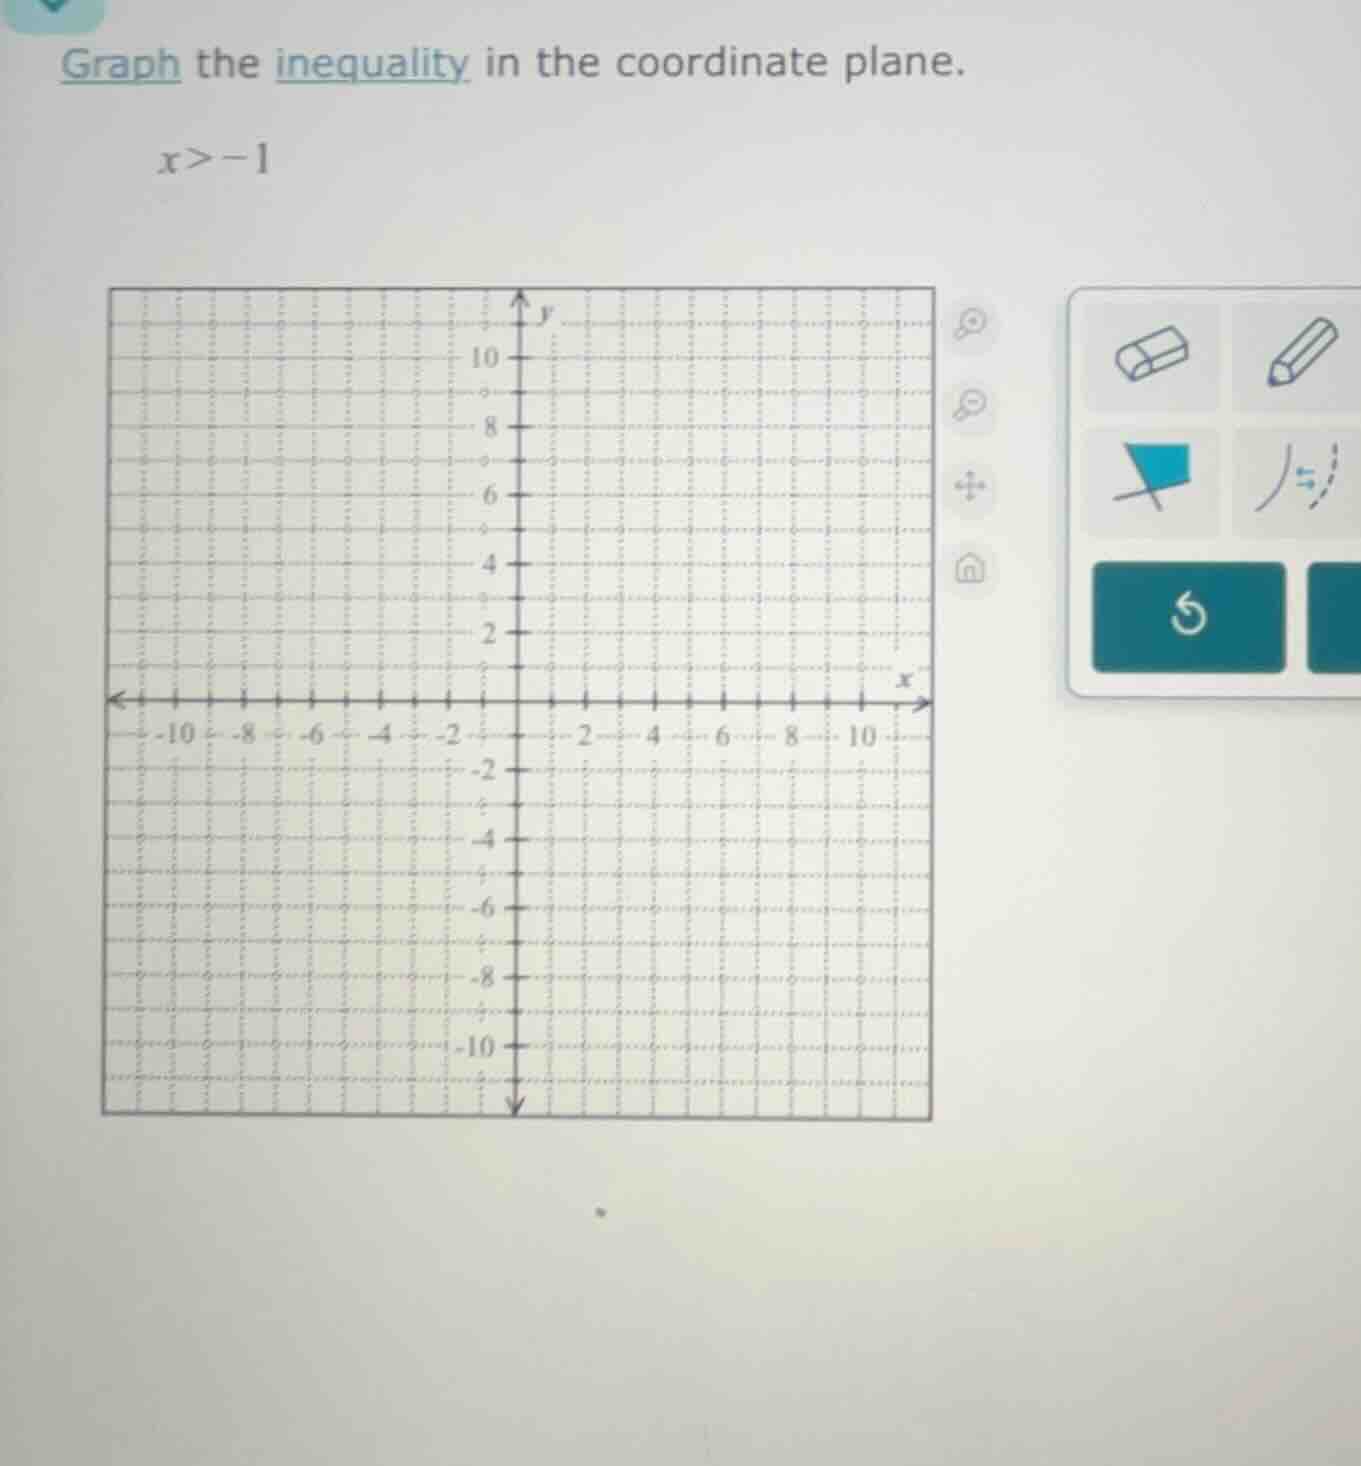
graph the inequality in the coordinate plane.
$x > -1$
Step1: Identify the boundary line
The inequality is \( x > -1 \). First, consider the equation \( x = -1 \). This is a vertical line parallel to the y - axis, passing through the point \( (-1, y) \) for all values of \( y \). Since the inequality is \( x > -1 \) (not \( x\geq - 1\)), the boundary line \( x=-1 \) should be a dashed line (to indicate that the points on the line \( x = - 1\) are not included in the solution set).
Step2: Determine the region to shade
To find the region that satisfies \( x > -1 \), we can test a point not on the line \( x=-1 \). Let's take the origin \( (0,0) \). Substitute \( x = 0\) into the inequality \( x>-1 \). We get \( 0>-1 \), which is true. So the region to the right of the line \( x=-1 \) (where \( x\) - values are greater than - 1) should be shaded.
Graphing Steps (Summary for the coordinate plane):
- Draw a dashed vertical line through \( x=-1 \) (this line will pass through \( (-1, - 10),(-1,0),(-1,10) \) etc., but since it's vertical, we can plot two points on the line, say \( (-1,0) \) and \( (-1,5) \), and draw a dashed line connecting them).
- Shade the region to the right of the line \( x = - 1\) (the region where all points have \( x\) - coordinate greater than - 1).
(Note: Since the problem is about graphing, the final answer is the graph with a dashed vertical line at \( x=-1 \) and the region to the right of this line shaded. If we were to describe the graph in text, that's the description. But for the purpose of following the format, the key steps are as above.)

Snap & solve any problem in the app
Get step-by-step solutions on Sovi AI
Photo-based solutions with guided steps
Explore more problems and detailed explanations
Step1: Identify the boundary line
The inequality is \( x > -1 \). First, consider the equation \( x = -1 \). This is a vertical line parallel to the y - axis, passing through the point \( (-1, y) \) for all values of \( y \). Since the inequality is \( x > -1 \) (not \( x\geq - 1\)), the boundary line \( x=-1 \) should be a dashed line (to indicate that the points on the line \( x = - 1\) are not included in the solution set).
Step2: Determine the region to shade
To find the region that satisfies \( x > -1 \), we can test a point not on the line \( x=-1 \). Let's take the origin \( (0,0) \). Substitute \( x = 0\) into the inequality \( x>-1 \). We get \( 0>-1 \), which is true. So the region to the right of the line \( x=-1 \) (where \( x\) - values are greater than - 1) should be shaded.
Graphing Steps (Summary for the coordinate plane):
- Draw a dashed vertical line through \( x=-1 \) (this line will pass through \( (-1, - 10),(-1,0),(-1,10) \) etc., but since it's vertical, we can plot two points on the line, say \( (-1,0) \) and \( (-1,5) \), and draw a dashed line connecting them).
- Shade the region to the right of the line \( x = - 1\) (the region where all points have \( x\) - coordinate greater than - 1).
(Note: Since the problem is about graphing, the final answer is the graph with a dashed vertical line at \( x=-1 \) and the region to the right of this line shaded. If we were to describe the graph in text, that's the description. But for the purpose of following the format, the key steps are as above.)