QUESTION IMAGE
Question
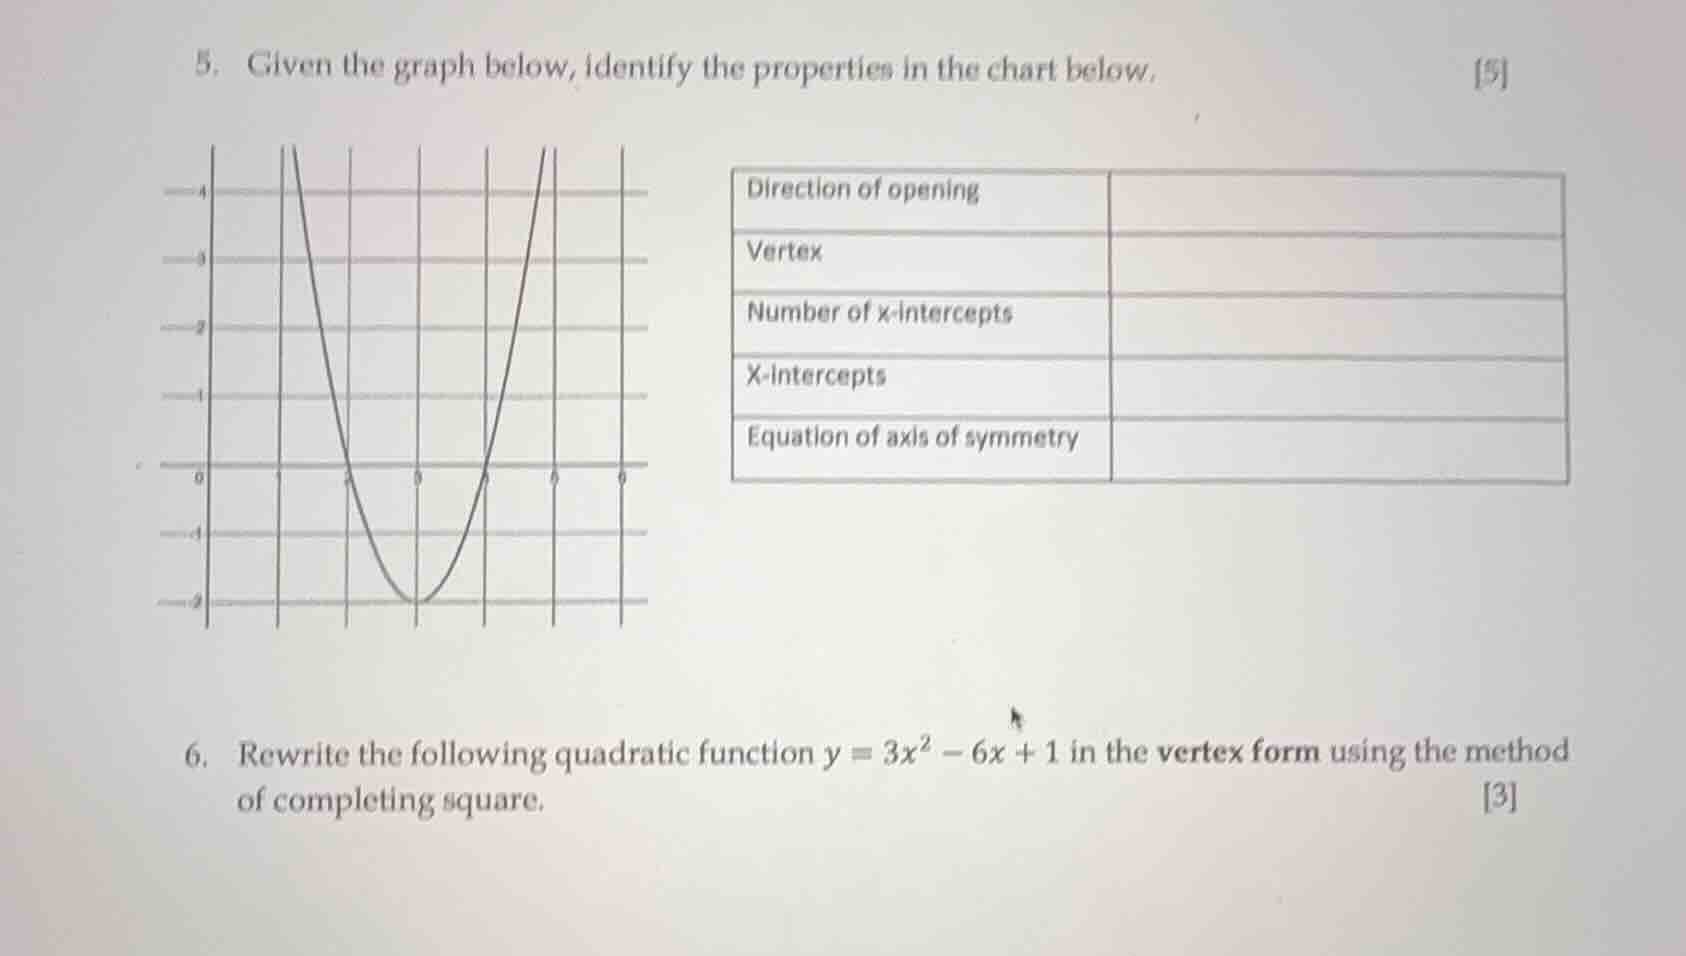
- given the graph below, identify the properties in the chart below. 5
\
$$\begin{tabular}{|l|l|}
\\hline
direction of opening & \\\\
\\hline
vertex & \\\\
\\hline
number of x-intercepts & \\\\
\\hline
x-intercepts & \\\\
\\hline
equation of axis of symmetry & \\\\
\\hline
\\end{tabular}$$
- rewrite the following quadratic function \\(y = 3x^2 - 6x + 1\\) in the vertex form using the method of completing square. 3
Analyze the graph properties
We observe the parabola's features:
- It opens upward.
- The lowest point (vertex) is at \((3, -2)\).
- It crosses the x-axis at two points: \((2, 0)\) and \((4, 0)\).
- The vertical line of symmetry passes through the vertex: \(x = 3\).
Complete the square for the function
We rewrite \(y = 3x^2 - 6x + 1\):
- Factor out the leading coefficient \(3\) from the variable terms:
$$y = 3(x^2 - 2x) + 1$$
- Complete the square inside the parentheses by adding and subtracting \(( -2/2 )^2 = 1\):
$$y = 3(x^2 - 2x + 1 - 1) + 1$$
- Expand and simplify:
$$y = 3(x - 1)^2 - 3 + 1$$
$$y = 3(x - 1)^2 - 2$$

Snap & solve any problem in the app
Get step-by-step solutions on Sovi AI
Photo-based solutions with guided steps
Explore more problems and detailed explanations
Question 5
| Property | Value |
|---|---|
| Vertex | \((3, -2)\) |
| Number of x-intercepts | 2 |
| X-Intercepts | \((2, 0)\) and \((4, 0)\) |
| Equation of axis of symmetry | \(x = 3\) |
Question 6
$$y = 3(x - 1)^2 - 2$$